I examine the opening chapter by Edward Wegman and Jeffrey Solka in the 2005 Handbook of Statistics: Data Mining and Data Visualization (C Rao, E Wegman and J Solka, editors). Sections 3 (The Computer Science Roots of Data mining ), 5 (Databases), 6.2 ( Clustering) and 6.3 (Artificial Neural Networks) appear to be largely derived from unattributed antecedents; these include online tutorials and presentations on data mining, SQL and artificial neural networks, as well as Brian Everitt’s classic Cluster Analysis. All the identified passages, tables and figures were adapted from “copy-paste” material in earlier course lectures by Wegman. The introduction to Chapter 13 (on genetic algorithms) by Yasmin Said also appears to contain lightly edited material from unattributed sources, including an online FAQ on evolutionary computing and a John Holland Scientific American piece. Several errors introduced by editing and rearrangement of the material are identified, demonstrating the authors’ lack of familiarity with these particular subject areas. This extends a pattern of problematic scholarship previously noted in the work of Wegman and Said.
Introduction
The pending retraction of Said, Wegman et al 2008 in Computational Statistics and Data Analysis (see part 1 and part 2) has led to a renewed focus on the problematic scholarship of George Mason University professors Edward Wegman and Yasmin Said. The unattributed appropriation of social network analysis background in the CSDA article and the earlier Wegman et al congressional report from two text books has garnered most of the attention. But the same pattern of “copy-and-paste” scholarship and lack of competence or domain knowledge can be seen in the other background sections of the Wegman report, including section 2.1 on tree-ring and other paleoclimatology proxies, and section 2.2 on principal component analysis and noise models. I also showed a similar pattern in Wegman and Said’s 2010 overview article on Colour Theory and Design in Wiley Interdisciplinary Reviews Computational Statistics (see parts 1 and 2).
Today I examine two chapters in in the Handbook of Statistics: Data Mining and Data Visualization (Elsevier, 2005), edited by eminent statistician C R Rao along with Wegman and Jeffrey Solka. Solka obtained his PhD in 1995 under Wegman and has been working at the Naval Surface Warfare Center and teaching at GMU.
Most of my attention will be on the opening overview chapter, Statistical Data Mining, by Wegman and Solka, although I’ll also take a quick look at chapter 13, On Genetic Algorithms and their Application, by Wegman protege (and “hockey stick” report co-author) Yasmin Said.
As in the case of the WIREs colour overview article, certain sections of Statistical Data Mining rely heavily on lightly edited portions on lectures from Wegman’s statistical data mining course at GMU. In turn, those lectures contain “copy-and-paste” material from a variety of sources, some partially attributed and some not at all.
The following table shows the main identified antecedents and the GMU course lecture that provided the “flow through” source for the particular chapter sections.
[UPDATE: As noted in a comment by “harvey” at least some of the antecedent slides in the Bajcsy presentation appear to be based on passages in Data Mining Techniques by Michael J. A. Berry and Gordon Linoff (1st ed., 1997, Wiley). ]
| Bajcsy PPT (Berry & Linoff) | SDM3-2003 | 3. Computer science roots of data mining |
| SQLCourse.com | SDM3-2003 | 5. Databases |
| Everitt (1993) | SDM8-2003 | 6.2 Clustering |
| StatsSoft Neural Networks | SDM11-2003 | 6.3 Neural networks |
Before moving on to the details, the acknowledgments section of the chapter should be noted:
The work of E.J.W. was supported by the Defense Advanced Research Projects Agency via Agreement 8905-48174 with The Johns Hopkins University. This contract was administered by the Air Force Office of Scientific Research. The work of JLS was supported by the Office of Naval Research under “In-House Laboratory Independent Research.” Figures 21 through 24 were prepared by Professor Karen Kafadar who spent time visiting E.J.W. During her visit, she was support by a Critical Infrastructure Protection Fellows Program funded at George Mason University by the Air Force Office of Scientific Research. Much of this chapter summarizes work done with a vast array of collaborators of both of us and we gratefully acknowledge their contributions in the form of ideas and inspiration.
Thus, as in the CSDA case, this work relied on federal funding. The acknowledgment of collaborators is interesting as well, insofar as these received ample citations, while the sections detailed below were free of any citations at all.
Section 3 – Computer science roots of data mining
The main antecedent in this section appears to be a course presentation, Introduction to Data Mining, by Peter Bajcsy of the University of Illinois. I’ll draw on examples from the 2002 version of the course; although the course appears to date back 2000, earlier versions are unavailable. It should also be noted that Bajcsy acknowledges the contributions of other colleagues, notably Jiawei Han also of the Illinois, and the course also acknowledges two underlying references.
- Data Mining – Concepts and Techniques by J. Han and M. Kamber, Morgan Kauffman, 2001)
- Pattern Classification by R Duda, P. Hart and D. Stork (Wiley, 2001 2nd ed.)
So this particular version of the Bajscy course may not be the actual source for Wegman in all cases.
[UPDATE: As previously noted, at least some of the material identified in Bajcsy has itself an antecedent in Berry and Linoff’s 1997 Data Mining Techniques. For now I will note the antecedents, where it is possible to confirm them via Amazon search. And I still hope to have complete chain of provenance in part 2.]
But whatever the actual chain of provenance, it is clear that little of this section is original, as seen in the following examples.
Our first example from Wegman and Solka is definitional:
Data mining itself can be defined as a step in the knowledge discovery process consisting of particular algorithms (methods) that under some acceptable objective, produces a particular enumeration of patterns (models) over the data. The knowledge discovery process can be defined as the process of using data mining methods (algorithms) to extract (identify) what is deemed knowledge according to the specifications of measures and thresholds, using a database along with any necessary preprocessing or transformations.
The steps in the data mining process are usually described as follows. First, an understanding of the application domain must be obtained including relevant prior domain knowledge, problem objectives, success criteria, current solutions, inventory resources, constants, terminology cost and benefits. The next step focuses on the creation of a target dataset. This step might involve an initial dataset collection, producing an adequate description of the data, verifying the data quality, and focusing on a subset of possible measured variables. …
And so on. Virtually the same wording is found at p. 7 and p. 22 of the Bajcsy presentation, albeit in point form. First the exact same definitions:
Data Mining
A step in the knowledge discovery process consisting of particular algorithms (methods) that under some acceptable objective, produces a particular enumeration of patterns (models) over the data.
Knowledge Discovery Process
The process of using data mining methods (algorithms) to extract (identify) what is deemed knowledge according to the specifications of measures and thresholds, using a database along with any necessary preprocessing or transformations.
The description of data mining steps is almost identical as well:
Develop an understanding of the application domain
Relevant prior domain knowledge, problem objectives, success criteria, current solution, inventory resources, constraints, terminology, cost and benefits.
Create target dataset.
Collect initial dataset, describe, verify data quality, focus on a subset of variables.
The second step, “create target dataset”, is more or less unscathed, although the Wegman and Solka version has changed the order and added unnecessary verbiage. But the list of “application domain” activities shows small and baffling changes. A missing comma yields the nonsensical “terminology cost and benefits”, whatever that is. A more critical and telling problem is the change of “constraints” into “constants”. Is this a mistranscription or the result of a failure of automatic character recognition? Whatever the reason, it’s a fairly shocking error.
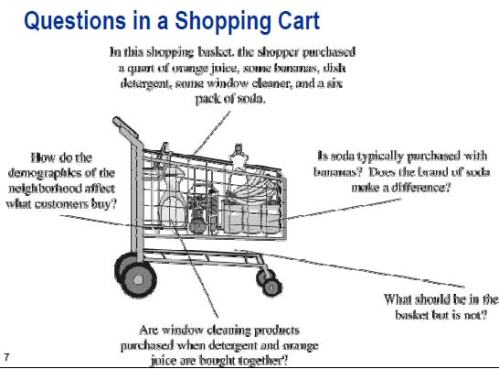
The core of section 3 is a description of “market basket analysis”, along with very specific examples of the technique at work. None of this material appears to be original.
The motivation for market basket analysis is stated by Wegman and Solka as a series of questions:
Where should detergents be placed in the store in order to maximize their sales? Are window cleaning products purchased when detergents and orange juice are bought together? Is soda purchased with bananas? Does the brand of the soda make a difference? How are the demographics of the neighborhood affecting what customers are buying?
Bajcsy asks the same questions at p. 40 of the presentation.
And the exact same image from Bacsjy can be found at p. 37 of Wegman’s SDM 3 lecture.
[Berry and Linoff have a similar figure at p. 125 of the earlier Data Mining Techniques, that is the ultimate antecedent, as stated by “harvey”. However, it still seems to me that the Bacsjy version was the proximate source; here is what appears to be the Berry and Linoff version (as reproduced in course notes from 2006 in a 23 Mb PDF).
What a tangled web! ]
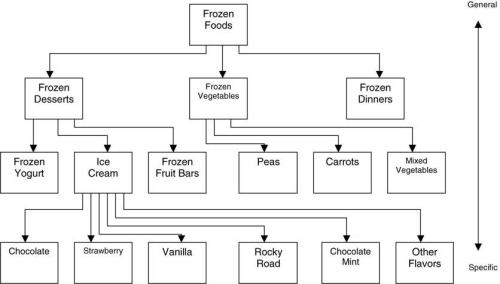
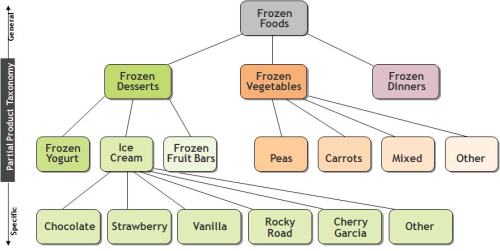
Another derivative figure is Wegman and Solka’s Figure 2:
This taxonomy table is found at p.50 of Bajcsy:
Not to mention, that once again, the identical figure is at p. 48 of Wegman’s SDM lecture 3. [The Berry and Linoff 1997 antecedent version is figure 8.4 at p. 135, although once again it appears not to be an identical figure. ]
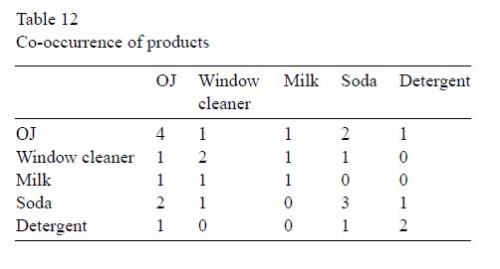
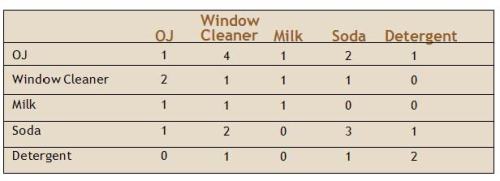
Another example is a table of “co-occurrence” of products in a small instructive example involving five customers and five products. The Wegman and Solka version:
[This example also occurs in Berry and Linoff, at p. 135, again as noted by “harvey”.]
In this case, the Wegman version is actually correct, since the co-occurrence of orange juice with itself is necessarily higher than its co-occurrence with window cleaner. Either Wegman corrected his source, or there is a common antecedent for this table.
Finally, we have the conclusion on market basket analysis.
Some of the strengths of market basket analysis are that it produces easy to understand results, it supports undirected data mining, it works on variable length data, and rules are relatively easy to compute. … Clearly if all possible association rules are considered, the number grows exponentially with n. Some of the other weaknesses of market basket analysis are that it is difficult to determine the optimal number of items, it discounts rare items, it is limited on the support that it provides.
The identical points are made in Bajcsy (p. 54-55) and found with the same exact wording in the Wegman lecture (typo and all):
Strengths of Market Basket Analysis
Weaknesses of Market Basket Analysis
Section 5 – Databases
Much of this section comes from an online tutorial that can be found in many places; I’ll use the version at SqlCourse.com. Here is the definition in Wegman and Solka (with asides for statisticians), followed by an example table:
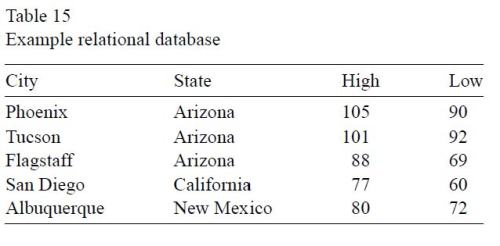
A relational database system contains one or more objects called tables. These tables store the information in the database. Tables are uniquely identified by their names and are comprised of rows and columns. The columns in the table contain the column name, the data type and any other attribute for the columns. We, statisticians, would refer to the columns as the variable identifiers. Rows contain the records of the database. Statisticians would refer to the rows as cases. An example database table is given in Table 15.
Here is the identical definition (without the asides, of course) and table from SQLCourse.com.
A relational database system contains one or more objects called tables. The data or information for the database are stored in these tables. Tables are uniquely identified by their names and are comprised of columns and rows. Columns contain the column name, data type, and any other attributes for the column. Rows contain the records or data for the columns. Here is a sample table called “weather”.
[C]ity, state, high, and low are the columns. The rows contain the data for this table:
| Phoenix | Arizona | 105 | 90 |
| Tucson | Arizona | 101 | 92 |
| Flagstaff | Arizona | 88 | 69 |
| San Diego | California | 77 | 60 |
| Albuquerque | NewMexico | 80 | 72 |
The rest of the section follows the tutorial quite closely, except for some fatuous statements about databases that I’ll return to in part 2.
Section 6.2 – Clustering
This section is derived entirely from Brian Everitt’s Cluster Analysis (3rd edition, 1993). A later edition of the book is given as a reference for clustering techniques, but there is no attribution of Wegman and Solka’s exposition.
Compare Wegman’s version of the clustering problem with Everitt’s original. The Handbook version:
The basic clustering problem is, then, given a collection of n objects each of which is described by a set of d characteristics, derive a useful division into a number of classes. Both the number of classes and the properties of the classes are to be determined.
Everitt has:
The problem which these techniques address may be stated broadly as follows:
Given a collection of n objects … each of which is described by a set of p characteristics or variables, derive a useful division into a number of classes. Both the number of classes and the properties of the classes are to be determined. [Section 1.3, p. 4]
As for motivation, Wegman and Solka state:
We are interested in doing this for several reasons, including organizing the data, determining the internal structure of the dataset, predication, and discovery of causes.
This is a ham-handed summary of Everitt:
In the widest sense, a classification scheme may represent simply a convenient method for organizing a large set of data so that the retrieval of information may be made more efficiently. …
In many applications however, a classification to serve more fundamental purposes may be sought. … To understand and treat disease it has to be classified and the classification will have two main aims. The first will be prediction – separating diseases that require different treatments; the second will be to provide a basis for research into aetiology – the causes of different types of disease. [Section 1.2, p. 2-3]
So the specific needs of disease classification have somehow morphed into a supposed general purpose of “predication” (instead of prediction) and aetiology. Lost too is Everitt’s general distinction between simple data organization for convenience or efficiency, and more fundamental motivations for clustering.
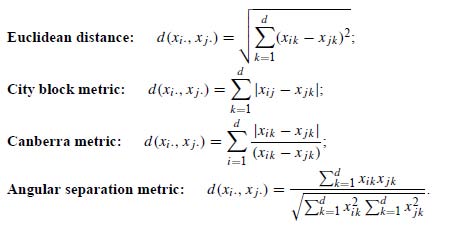
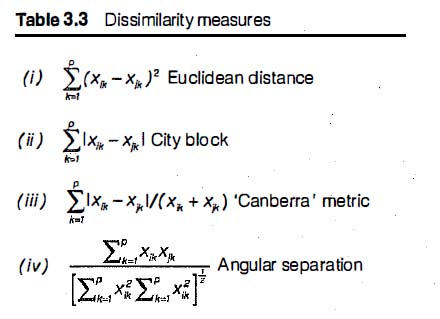
Cluster analysis generally relies on defining similarity (or dissimilarity) between various members of the data collection being analyzed. This can be done by employing one of various available measures of distance between data points. Here is Wegman and Solka’s list of common distance measures used to compute dissimilarity:
 And here is the corresponding list from Everitt:
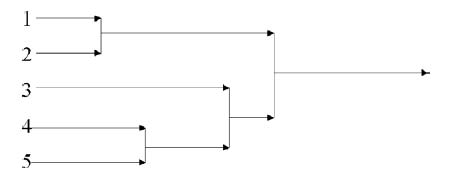
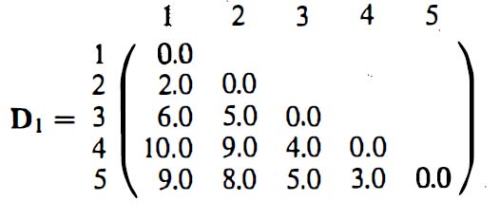
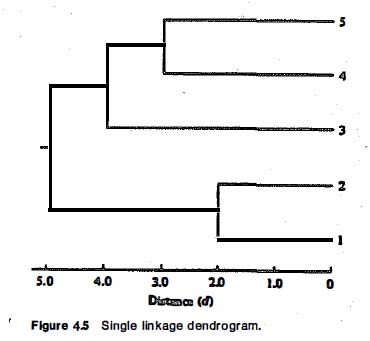
As in previous sections, Wegman and Solka draw heavily on their main source’s specific examples. A worked out example of single linkage agglomerative hierarchical clustering starts from a distance matrix for five data points and works through intermediate steps to arrive at a dendrogram (a chart representing the final hierarchical clustering solution):
Everitt has exactly the same example, albeit without the loss of pertinent distance information in the final diagram. Here is the distance matrix:
And following a series of agglomerative steps, fusing points and smaller clusters into larger ones, here is the final dendrogram:
The following section contains an egregious error, where Wegman and Solka purport to discuss the “number of groups” problem.
Section6.2.2. The number of groups problem
A significant question is how do we decide on the number of groups. One approach is to maximize or minimize some criteria.
But in fact, what follows is something completely different – a summary of optimization methods of cluster analysis (as opposed to the hierarchical clustering techniques previously discussed). The optimization methods divide the n data points into g groups according to maximization or minimization of a particular criterion. But these methods assume a predetermined number of groups (clusters) to be formed; the described criteria (which are the same as found in Everitt’s chapter 5) are ways to identify a specific optimal clustering into g groups.
Now Everitt does discuss the “number of groups” problem for both hierarchical clustering (i.e. “cutting off” before reaching the individual level) and optimization clustering methods. But none of this is covered (or copied) in the Handbook chapter.
How did such a huge error occur? A likely scenario is found by examining the underlying Wegman lecture. At p. 28 there is one slide on determining the number of relevant groups or clusters in hierarchical clustering, which would otherwise produce an unwieldy and overly detailed taxonomy of limited utility, right down to the individual level. This is followed by several slides on “optimization methods”. Thus it would appear that when these slides were reviewed to produce the passage in question, the slides on optimization clustering methods were mistakenly presumed to be a continuation of the “number of groups” topic.
Section 6.3: Artificial Neural Networks
This section is derived from a StatsSoft online statistics guide. The underlying Wegman lecture reproduces much of the chapter on artificial neural networks almost verbatim. However, some editing and rephrasing was attempted for the Handbook version:
An artificial neuron has a number of receptors that receive inputs either from data or from the outputs of other neurons. Each input comes by way of a connection with a weight (or strength) in analogy to the synaptic efficiency of the biological neuron. Each artificial neuron has a threshold value from which the weighted sum of the inputs minus the threshold is formed. The artificial neuron is not binary as is the biological neuron. Instead, the weighted sum of inputs minus threshold is passed through a transfer function (also called an activation function), which produces the output of the neuron. Although it is possible to use a step-activation function in order to produce a binary output, step activation functions are rarely used.
This is not so much clearly wrong, as it is somewhat incoherent. The original is much clearer and has hyperlinks to define key terms.
To capture the essence of biological neural systems, an artificial neuron is defined as follows:
- It receives a number of inputs (either from original data, or from the output of other neurons in the neural network). Each input comes via a connection that has a strength (or weight); these weights correspond to synaptic efficacy in a biological neuron. Each neuron also has a single threshold value. The weighted sum of the inputs is formed, and the threshold subtracted, to compose the activation of the neuron (also known as the post-synaptic potential, or PSP, of the neuron).
- The activation signal is passed through an activation function (also known as a transfer function) to produce the output of the neuron.
If the step activation function is used (i.e., the neuron’s output is 0 if the input is less than zero, and 1 if the input is greater than or equal to 0) then the neuron acts just like the biological neuron described earlier (subtracting the threshold from the weighted sum and comparing with zero is equivalent to comparing the weighted sum to the threshold). Actually, the step function is rarely used in artificial neural networks, as will be discussed.
This section follows the original quite closely. Although the attempt to rephrase and summarize tends to obfuscate the text, there appear to be fewer of the outright errors apparent in some of the other sections.
Chapter 13 (Yasmin Said): On Genetic Algorithms and their Application
The opening of this chapter appears to draw heavily from three sources:
- Evolutionary Computing FAQ (from “An Overview of Evolutionary Computation”, ECML: European Conference on Machine Learning [ECML93], 442-459.
- Melanie Mitchell, An introduction to genetic algorithms, MIT Press, 1998.
- John H. Holland, “Genetic Algorithms”, Scientific American, July 1992.
I have produced a detailed side-by-side comparison of Said’s text to the above originals for those interested. However, here I will show just one example paragraph. Here is John Holland, the inventor of genetic algorithms, describing how genetic algorithms mimic biological reproduction.
Biological chromosomes cross over one another when two gametes meet to form a zygote, and so the process of crossover in genetic algorithms does in fact closely mimic its biological model. The offspring do not replace the parent strings; instead they replace low-fitness strings, which are discarded at each generation so that the total population remains the same size.
Now here is Said’s rendering of that same paragraph.
Biological chromosomes perform the function of crossover when zygotes and gametes meet and so the process of crossover in genetic algorithms is designed to mimic its biological nominative. Successive offspring do not replace the parent strings; rather they replace low fitness ones, which are discarded information at each generation in order that the population size is maintained.
We have seen this style of summarization before, where Said manages to add verbiage, while subtracting information. Low-fitness strings are not merely “discarded”; rather, they are “discarded information”. And GA’s “biological model” is now a “biological nominative”, whatever that is. But the real howler is Said’s description of crossover (now the “function of crossover”) as “when zygotes and gametes meet”. Uh, no. As Holland clearly stated, two gametes “meet to form a zygote”.
There had been some progress since Said’s PhD dissertation the year before, however. At least this time, she managed to interweave strikingly similar material from three different sources, instead of just copying one.
Conclusion
This examination has provided an important new piece in the documentation of the downward spiral of the scholarship of the Wegman group. I have shown large-scale use of unattributed material, along with attendant errors, in several sections of an advanced statistical text book on data mining. This not only establishes a pattern of problematic scholarship involving Edward Wegman and Yasmin Said in the period just before the Wegman report. It is doubly shocking as it involves material supposedly within the authors’ sphere of expertise, and even taught by Wegman in courses.
I should also mention that it is highly improbable that Jeffrey Solka bears direct responsibility for the problems documented above, as the passages in question were derived from Wegman’s course lectures.
I’ll return to the Handbook for a more detailed analysis, including colour coded side-by-side analysis of Chapter one sections and identification of further unattributed antecedents. I’ll also examine Wegman’s peculiar personal approach to literature review, whereby the contributions of major figures (like Usama Fayyad) are given short shrift, while his own proteges are given a disproportionate attention. And I’ll also take a look at the evolution of the Statistical Data Mining course itself, an evolution which yields important clues about the descent of the Wegman group.
And I’ll also be posting a summary page of all the problematic scholarship identified by myself and others so far, something I’ve been meaning to do for some time. If nothing else, it will provide a convenient resource for George Mason University when they finally get around to launching a full blown investigation of the ever-growing mountain of evidence of misconduct. But before I do that, there is one more shocking piece in the Wegman and Said saga to report, so stay tuned.



In for a penny, in for a pounding.
The plagiarism here, as one expert once said in the USAToday, is “fairly obvious.” That expert regrets using the modifer “fairly,” and should have said “is as obvious as a baseball bat upside the head,” but he knows that the USAToday wouldn’t have printed that. Anyone with the least modicum of ability to think critically will necessarily conclude the obvious in this latest case.
I don’t know about you, but I hate when my zygotes and gametes meet. It’s so embarrassing; I never know what to say.
“Biological chromosomes perform the function of crossover when zygotes and gametes meet . . .”
Technically this is plagiarism plus palinization.
Yeah, this usually results in evolutionary monsters, if successful. Which I suppose is appropriate!
What I want to know is what Wegman has against Cherry Garcia icecream!?
It’s easy to imagine Wegman saying “infamy, infamy, they’ve all got it in for me.”
He probably flunked the Acid Test
Drip drip drip drip.
Oh what a tangled web we weave when first we practice to deceive.
I had never heard of the Canberra metric and looked it up. Wegman’s definitiion differs from Everitt’s and looks wrong. The metric was initially devised for positive values only and is meant to vary between zero and the number of data points. Wegman’s metric can easily diverge.
Good catch. It does appear that Wegman’s version could vary from -p to p (where p is the number of variables or attributes).
For all the consequences with regard to the math involved, it looks like a simple typo in an example mentioned in passing, which wasn’t caught.
Who cares?
“Who cares?”
Apparently you do… you’re sweating 😉
Actually, Holland got the biology wrong – crossing over happens during meiosis, as the gametes are being created, not during zygosis. But at least Holland got the basic definitions correct.
Said’s version of that sentence utterly disqualifies her IMO from ever being taken seriously as a scholar, even if all the rest of the academic dishonesty had never happened. She is using words that are foundational to her argument, and that she doesn’t understand, without bothering to check a dictionary. It don’t get much more basic than that.
“Who cares?”
Anyone who has ever had Wegman et al’s “work” used to accuse them of incompetence or dishonesty, for starters.
There are several additional inaccuracies introduced in the text copied from Holland:
“”First, each string in the population is ranked to determine the execution of the tactic that it predetermines”. Not only are those extremely peculiar choices of words, Said is here suggesting ranking the fitness of the individuals *before* determining the fitness. Granted, if Wegman and his students do have access to a time machine, they would probably find that useful right about now.
“a random point along the strings is selected and the portions adjacent to that point are swapped to produce two offspring”. This has changed the “single-point crossover” described by Holland into a slightly odd variant of a two-point crossover. Nothing particularly wrong just yet, two-point crossover is fine, but then: “one which contains the encoding of the first string up to the crossover point, those of the second beyond it, and the other containing the opposite cross” – that is still a description of a one-point crossover.
Got the divergance bit wrong, when I glanced at it. I saw, that the denominator can become arbitrarily small and did not check, that the denominator would keep the ratio from diverging. However, metrics need to be non-negative, so Wegman’s formula is anything but a metric.
The co-occurrence of products matrix is found also, e.g., here:
lacking the Bajcsy error, but having (in the first version) one of its own. It is by one Saswat Pati, and isn’t spoiled with references either. Uploaded Jan 13 this year… hardly his own handywork.
Then there is
by Avijit Karan, uploaded May 15 this year. This one contains first a fully correct matrix, and then one containing the Bajcsy error…
I get the distinct impression that both contain lots of unattributed copying. But, where from?
Then,
by Vinay Bandhari, Jan 18.
Several more, google “co-occurrence of products”… who copied whom?
To be perhaps a bit picky, neither of the tables given in the database section above are examples of relational database tables.
A relational database table would not contain multiple entries for “Arizona” or other states. The table would contain a foreign key that relates (hence the name relational) to a primary key for an entry in a “state” table.
Sorry, it is offtopic but the table really can contain multiple entries for “Arizona” is that is also a primary key value in the “state” table.
The real problem with Wegman’s database source is that it is aimed at a popular audience and is way too low a level for the intended readership of the Handbook.
“co-occurrence of products”
you may be interested in:
http://www.data-miners.com/dmt_companion.htm
specifically
http://www.data-miners.com/companion/ch09thumbs.html
and
http://www.data-miners.com/companion/Chapter9.ppt
these are chapter by chapter resources for the second edition of the book:
Data Mining Techniques (third edition)
http://www.data-miners.com/bookstore.htm
the first edition was published in 1997.
On the Resources page:
“Chapter by Chapter Resources
The material in this section is meant to help instructors who are using Data Mining Techniques as a classroom text. Permission is granted to use the illustrations in presentations or classroom notes so long as they are clearly identified as coming from Data Mining Techniques (Second Edition) by Michael J. A. Berry and Gordon S. Linoff, Copyright 2004, John Wiley & Sons.
The PowerPoint presentations offered here are from Professor Ronald J Norman of National University in La Jolla, California. Dr. Norman used these slides in his data mining course based on Data Mining Techniques (Second Edition). If others have material they would like to share on this site, please send e-mail to info@data-miners.com. “
The datamodel’s not normalized but it’s still being implemented in a relational database.
So what’s the difference between plagiarism (defined as the appropriation of the ideas, processes, results, or words of another person, without giving appropriate credit), an action that essentially involves stealing something valuable and promoting it as your own, be it words, ideas, etc., and something more dishonest? Plagiarism can be the result of simple laziness or haste, or it can be more deliberate. I have observed this type of plagiarism first-hand in cases ranging from freshmen term papers to proposals and publications by members of the National Academy of Sciences. Even if the plagiarized text has been rewritten or paraphrased, it still represents plagiarism. However, and this is a BIG however, when that rewriting or paraphrasing results in mistakes that change the meaning of the plagiarized text or idea or result, that is no longer just plagiarism; it constitutes falsification (defined as manipulating research materials, equipment, or processes, or changing or omitting data or results such that the research is not accurately represented in the research record). If the rewriting or paraphrasing introduces mistakes such as typographical errors or misstatements of fact, this represents simple incompetence (on top of plagiarism and potentially falsification).
Well, a first stab at the falsification issue is the recent Strange Falsifications in the Wegman Report.
The nice thing about near-verbatim plagiarism is that it may be hard to find, but once found, is easy to display convincingly.
Falsification is much harder, but it helps when someone methodically distorts, contradicts (Very) serious statistician Andrew Gelman has a new blog post out on DC’s latest finds, see Another Wegman Plagiarism.
John, pointing out problems with ignorance, plagiarism, contradictions and falsehoods is one thing. Those are facts printed in paper and I respect your and DC’s work deeply for that. But accusing someone of *intentionally* distorting the information copied from others is perhaps another thing. However much it appears to be the case, proving it seems difficult. I wonder if you have thought about the chances of this leading to a possible libel case against you?
Another thing is, ‘skeptics’ often accuse climate scientists they disagree with of fraud and other libellous stuff. This is always condemned by the more rational side of the blogosphere. Aren’t you decending to the same level of tactics now? And do you deem that necessary, or is it a necessary step towards more official complaints of academic misconduct later?
Another from Gelman, this one a Top Ten List.
” However much it appears to be the case, proving it seems difficult.”
In civil actions in the US, the standard is “a preponderance of evidence”, not “beyond a resonable doubt”. A pattern of behavior is one of those things that can lead a rational juror or judge to accept that there’s a preponderance of evidence.
While no actual court case will be brought here, I think that’s a reasonable bar to set.
Specious claims of “fraud” or “worldwide conspiracy of scientists” etc don’t meet the laugh test, much less the preponderance of evidence test. Claiming that there’s any moral equivalency is just odd, and suggesting that John or others should shy away from actively exposing *real* scientific misconduct because false charges are made against others is even odder …
A couple of comments.
Its not sparkling scholarship but given the context I would not call Said’s thin-reworded of cited sources plagiarism. But Elsevier should definitely investigate their quality control.
I can’t see you’ve established that Wegman didn’t write the material common to Bajcsy & Wegman/Solka.
In this context relying heavily on a source to e.g. provide an explanation of SQL is fine but lack of attribution is, of course, not acceptable. But I’d say less serious than the other plagiarism you’ve uncovered.
Three of the examples I gave occur as identical slides in Bajcsy and the Wegman course lecture. The Bajcsy Ppt shows a creation date of 2000. There is zero chance that Wegman originated those slides.
The Holland antecedent I found is not cited by Said.
The creation date for Bajcsy’s linked powerpoint shows as 00/00/00 to me – which may just be my software failing to read the date. But some people are the habit of editing a previous presentation(ppt) to produce a new presentation, even if there is no common content beyond author+affiliation – which could result in a creation date being that of the original presentation.
Wegman put his content on the web in 2001 (creation date in ppt shows as Feb 2001), so I ‘d be very careful about making inference based on date.
Poor reading on my part, I hadn’t noticed that Said hadn’t cited that Holland article.
Also BTW, 10+ pages of text from Said’s (2005) chapter can be found verbatim in the 2008 book “Evolutionary Intelligence: An Introduction to Theory and Applications with Matlab” by Sumathi et al published by Springer which doesn’t cite Said. Very depressing.
Andrew, hope you contact Springer about that.
Actually depressing is also that this book subscribes to ‘Intelligent design’ — with Dembsky in the reference list. Almost comical that it would present a mathematical methodology the functioning of the biological analogue of which it is in denial about…
There are levels of intent here. While it is difficult to prove that someone intentionally misleads by altering ‘plagiarised’ text it can be clearer to see that they knew they were deceiving the audience about their expertise. They didn’t mean to confuse, but they did cheat us by asserting a level of expertise that was false. It is this latter issue that is under examination here. It is not the copying per se that is the academic crime in plagiarism (and I wish more people would understand this) it is the pretence of expertise and the creation of a false authority.
See:
Data Mining Techniques: For Marketing, Sales, and Customer Support
1 edition (May 27, 1997) | ISBN: 0471179809
Michael J.A. Berry and Gordon Linoff
The market basket example picture originates in the chapter on market basket analysis (page 125)
The co-occurrence of products table on page 131
The Taxonomy table on page 135
From Berry and Linhoff page 131
———————————————————-
The co-occurrence table contains some simple patterns:
• Orange juice and soda are more likely to be purchased together than any other two items.
• Detergent is never purchased with window cleaner or milk.
• Milk is never purchased with soda or detergent.
These simple observations are examples of associations and may suggest a formal rule like: “If a customer purchases soda, then the customer also purchases milk.” For now, we defer discussion of how we find this rule automatically. Instead, we ask the question: How good is this rule?
—————————————————
From Wegman page 12
————————————————–
A cursory examination of the co-occurrence table suggest some simple patterns that might be resident in the data. First we note that orange juice and soda are more likely to be purchases together than any other two items. Next we note that detergent is never purchased with window cleaner or milk. Finally we note that milk is never purchased with soda or detergent. These simple observations are examples of associations and may suggest a formal rule like: if a customer purchases soda, then the customer does
not purchase milk.
With this example in hand, I’ll take a look at its chain of provenance, which undoubtedly passes through the Wegman SDM course lecture and probably through the Bacsjy presentation. I’ll try and confirm that later, although I’m in a very low bandwidth setting for the next couple of days.
http://www.ebook3000.com/Data-Mining-Techniques–For-Marketing–Sales–and-Customer-Support_127176.html
also see my previous post June 8 at 10:35
how did I find this?
I used google advanced search and kept reducing the time period to an earlier and earlier time until i only found the one precident.
Hmm what should I call that algorithm..GoogleWarp?
There’s a discussion of M&M’s select for sticks trick over at Moyhu
Jhn McManus
Suggestion: Sam’s comment stirred me up on falsification,. but for focus, how about either taking that to an Open Thread or a new different one, then keep this one on the specific plagiarism topic. This one looks like the typical plagiarism to create illusion of expertise, with the usual admixture of gaffes from incompetence. Falsification really should be a separate topic.
[DC: It’ll have to be the Open Thread for now.]
climatescientist, one might extend your description of the “academic crime” of plagiarism (“pretence of expertise and creation of false authority”). It’s a form of cheating associated with aggrandisement for the purpose of undeservedly advancing one’s prospects. Wegman and Said (as a youngish professor) want to be “going places”, and for that they need a steady stream of published stuff. Writing about stuff they know very little about is easy if they can just regurgitate a mishmash of other’s work. Apart from the plagiarism, the quality of the output that we’ve seen is abysmal, and that seems of little concern to them – an apparent lack of personal standards of quality.
It’s useful to recognize that their plagiarism is of a fundamentally different nature to the various bits of plagiarism we occasionally encounter in our students. In these cases plagiarism seems generally to arise from (i) laziness, (ii) poor skills in properly summarizing information from source material or (iii) panic in the face of looming deadlines. While all of the latter is unfortunate (and results in various penalties according to the degree of seriousness), it doesn’t share the rather nasty features of couldn’t-care-less self-aggrandizement on show in the examples uncovered here.
Hmmm, how many editions of this text are there? What is the most recent edition? Seems to me, if it is still being published, it must be a guide to success.
Third edition copyright 2011…
http://www.data-miners.com/index.htm
Hmmm plagiarism is a form of data mining in a loose, non-technical definition of the term …
as a scientists (PhD, molecular biology) and a person who doesn’t know much about climate skeptics, but considers them as probably cousins to intelligent design “scientists”, I would say this attack is non scientific, because it lacks an obvious control
If you took 10 books similar to the one under attack, what would you find ?
I am sure if you took introductory college texts in biochemistry, which I learned from teh famous “lehninger” you would find many paragraphs that are similar.
So, it could be that what this column describes as plaigarism is widespread, if not much talked about, practice
not sure that makes it right, but it makes wegman no worse then others (although is his student yasmin did make a howler with the gamete and zygote meeting…)
“I am sure if you took introductory college texts in biochemistry, which I learned from teh famous “lehninger” you would find many paragraphs that are similar.”
I don’t think that’s true. Of course paragraphs describing similar things might be “similar” but they wouldn’t be plagiarized. There is a very straightforward difference. In any case Lehninger (I also have a copy!) isn’t an example of the type of book under discussion here, which is essentially a collection of articles by different authors. There is no justification for the blatant plagiarism of the style highlighted here, in what is supposed to be an orignal chapter on a particular sub-topic in a multi-author collection.
And I’d be very surprised if you were to find plagiarism in Lehinger. But why not have a go! I don’t believe that plagiarism is “widespread” at all. The style of plagiarism uncovered here is an indication of a fundamental dishonesty, at the very least an appalling misunderstanding of acceptable standards of scholarship. In my scientific career (also Mol. Biol.) I’ve encountered only a very few individuals that are dishonest or lacking in acceptable standards of scholarship.
It seems like a example of how to study co-occurrence has no reason to be limited to a tiny subset of items, while a description of the nature of the alpha helix structure in proteins is more limited, don’t you think, cin-col?
Pingback: Plagiarism | The Freelancing Researcher
cinnamoncolbert: Excellent suggestion.
I’m also loosely mol biol, but the standard text I have in front of me is Atkins’ Physical chemistry. Let’s try a few very short fragments of the general nature that might get copied in the same way:
“we consider the phase diagram of a binary mixture” – 1 google hit, no correspondence beyond those words.
“planck’s discovery that an electromagnetic oscillator” – 0 google hits.
“the total enthalpy of the reactants and the total enthalpy of” – 1 google hit – the original work
“the rates of most chemical reactions increase as the temperature is raised” – 6 google hits. 1 unrelated. Interestingly the other 5 could be related to eachother. Checking – ahh they are all the same online book, or online lecture materials to go with it.
That’s a start. Repeat until bored.
Cinnamoncolbert: go for it! Looking forward to your report on your attempt to falsify your hypothesis. Here’s your book:
http://books.google.com/books?hl=en&lr=&id=7chAN0UY0LYC&oi=fnd&pg=PR5&dq=lehninger+college+chemistry&ots=MAgZ8EH_hB&sig=iK3Lcl9DolPpDYo94juV-HLgcWs#v=onepage&q=lehninger%20college%20chemistry&f=false
PS for Cinnamoncolbert — keep any hyphenations when you do your search; compare what you get with this, compared to the search without the included hyphen:
http://www.google.com/search?q=%22the+glycine+decarboxylase+complex+and+photores-piration%22&ie=utf-8&oe=utf-8&aq=t&rls=org.mozilla:en-US:official&client=firefox-a
I admire DeepClimate’s follow-the-money, follow-the-science work, and congratulate John Mashey and DC on exposing the Wegman report as an even shoddier sham than I thought it was.
But if you’ll pardon me saying so, I find the recent follow-the-copy-paste into non-climate-related areas of Wegman/Said’s work a bit weird.
CM: quite a few people rely on Wegman as a respected statistician and trustable authority, as for example, thje McShaen+Wyner paper does.
Why is it weird to follow other evidence to evaluate that credibility?
In particular, once upon a time some of us thought the Wegman Report was an aberration of behavior, but DC’s finding these others indicates that the scholarship in the WR, while strange and extreme, was only one example of a larger pattern.
When DC exposed the first problems December 2009, I had no idea how many more problems would be found … but every time we turn over a rock, weird things crawl out and head for new rocks we hadn’t noticed.
Last March, I expected to be done by July 2010. It seems to never end.
> Last March, I expected to be done by July 2010.
Surely you mean March 2010? Yes those years go faster an faster, an Olympiad every year now it seems 😉
I interpret that as meaning that GMU would have done something by July 2010, but now it’s been so long that I can’t remember what the supposed deadlines for decisions, action, etc should have been. What a bunch of culls.
Right – GMU should have decided the outcome of the inquiry (i.e. to decide whether to proceed to full-blown by investigation or not) by July 2010. But GP’s point is that John thought this in March 2010, not “last March”. Of course that depends what one means by “last March” – some (not me or GP I hasten to add) might mean “March of last year”.
Anyway, it has taken an inordinately long time just for the inquiry. That’s 15 months since the initial complaint and counting, for a process that is only supposed to take 60 days. Perhaps they’re going for the record.
Yes, I’m in the group that reads that as March 2010. Of course, had GMU done their job properly, we wouldn’t need to distinguish between “last March” and “this last March”. Yikes.
Yes, sorry, life is busy right now,:
when I finished the 185-page CCC March 15, 2010 I of course had some loose ends. [But his is like software, if you wait until you have every feature you want and have fixed all bugs … you may never ship.
The loose ends were especially in Appendix A.10 on the Wegman Report, a small fraction of the document.
pp.167-168 addressed purposefulness of the copying/editing, i.e., not just forgetting to quote, and commented shortly on the distortions, which were far more complex to describe, and didn’t make it into SSWR. I’ve tried recently in Strange Falsifications in the WR,a s that was a loose end left from the WR.
pp.169-171 mentioned some immediately-obvious oddities of the WR’s bibliography, and that was a loose end.
So, I thought I’d take a thorough look at the Bibliography …which of course turned into the scholarly absurdity described inSSWR W.8, pp.165-186.
Then, while DC is especially adept at finding antecedents in odd places, I idly wondered about the Summaries of Important papers, which seemed to have some odd choices, sort of looked OK at first read, but then looked odder if you looked closer. After all, those were the heart of the literature review, not “just introductory boilerplate”. So I thought I’d go do a quick sample, if by chance there was any plagiarism, especially since I didn’t have to spend any time *finding* the antecedents … low-hanging fruit!
Of course, every single summary had problems … but still I expected to be done by July and get on to other efforts.
But as I’d looked at every citation to see which references were covered, I noticed various oddities … and when I cross-checked what the original articles said, how they were Summarized, and then used in the body, more problems cropped up. I kept adding sections … and then gave up and had to cover the whole thing … and again, I thought I was pretty close in August, and McShane-Wyner popped up, as did the disappearance of key files, whose cause was only revealed later.
During all this there were multiple reviews from various folks, sometimes good suggestions that caused serious restructuring, especially of the context at the front. The final report was nothing like what I expected to write starting March 2010, and my views on who did what or might have, changed multiple times as more information appeared.
I would summarize by saying it was like turning over a rock, finding things underneath that scuttle or slither to other rocks you hadn’t noticed, and the same thing happened again, recursively.
Hence, the oft-spoken motto:
it never ends.
I’ve been reading through Ray Bradley’s new book “Global Warming and Political Intimidation”
Here’s my favorite paragraph so far (all typos are my own)…
Ouch!!! That’s gotta leave a mark!
I was wondering if there was any new…news on what has been going on with the Wegman investigation at GMU?
Is it possible the investigation was completed but the results never made public?
The last update by USAToday’s Dan Vergano on May 26, 2011 quoted GMU spokesperson Dan Walsch as saying the review was still in its “preliminary inquiry” stage. Mr. Walsch says his “understanding of the internal procedure was not as clear then [last fall] as it is now.” Funny, since one of the criteria the Southern Association of Colleges and Schools (SACS) uses to evaluate an institution’s accreditation status is whether it has and follows clearly established procedures for addressing misconduct allegations such as those against Dr. Wegman. GMU’s accreditation renewal is currently under review by SACS.
As of last week, it was still under review, i.e., at 17 months and still counting.
So GMU is at 17 months and counting just on the preliminary inquiry. They should be able to wrap up what should have been a two-month preliminary proceeding in two years. And the investigation itself shouldn’t go past 2023 or 2024.
I guess they are operating on GMU Standard Time.
Hmm, what sanctions are there against this dragging it out forever? There must be some lawyer type somewhere who foresaw a thing like this could happen, and invented a rule for this?
To paraphrase an old movie line: “Rules? We don’t need no stinkin’ rules”.
Pure speculation, but I wonder if this will be drawn out until a semi-graceful retirement exit can be arranged.
Retirement doesn’t solve the image problem of a forever investigation… also, GMU is a big university and has also departments that do legitimate, even good, science… aren’t those folks worried about losing access to federal funding?
Time for Vergano to do a bit of phoning around again?

Is this blog discontinued? It has been more than 2 months since the last post.
[DC: No, despite the long hiatus, I do have plans to start up again soon, and then have major posts about twice a month. I hope you consider that good news. ]
I do!
I consider it great news!
John McManus
Yay!
See this?
http://scienceblogs.com/deltoid/2011/09/yet_another_example_of_wegman.php
I saw the Gelman piece (and commented there), but thanks for the link to Deltoid.
The first hint of trouble with the Said and Wegman WIREs Optimization article came last year in a Reader Suggestion by Ameoba.
What can I say? I should have paid closer attention.
But by last March, I was paying attention to this comment.
And last May I wrote:
As I said at Gelman’s, stay tuned – shouldn’t be too long now.