
In retrospect, 2014 was an interesting year for climate watchers, and a turning point of sorts. That year, global mean surface temperature matched record highs for the instrumental period, without any assist from the El Nino weather pattern that usually accompanies such warm years. That turned out to be a prelude to a record-smashing 2015. And 2016 may well provide an unprecedented third surface temperature record in a row, as the influence of the current super El Nino will likely peak in the first half of this year.
But 20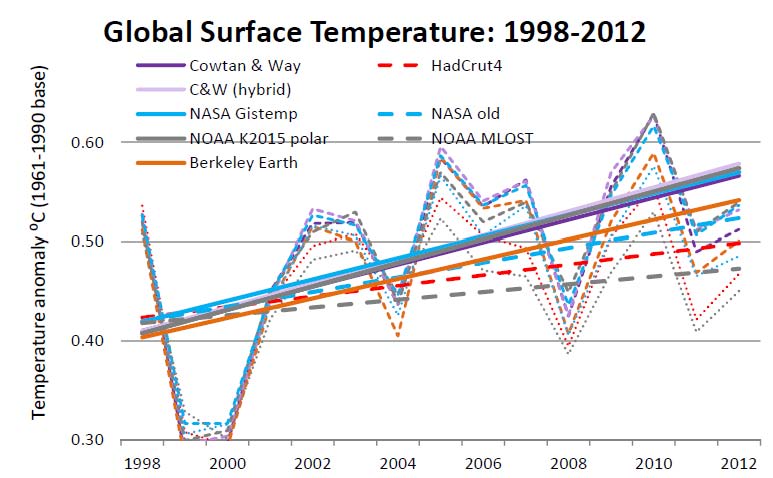 14 was also notable scientifically for the emergence of a previously under-examined scientific issue: namely coverage bias in observed surface temperature series, especially the HadCrut4 record issued by the UK Met Office.
This most widely cited temperature series does not account for missing areas, especially in high latitudes, likely leading to an underestimate of the overall rise in global temperature since the 19th century.
Not only that, but there is increasingly compelling evidence that the recent short-term slowdown in the surface temperature record was much less pronounced than previously estimated, if rapid Arctic warming is fully reflected, along with potential biases from the changing mix of sea surface temperature measurement sources in recent years. Thus the discrepancy between very short-term and multi-decadal trends in the observations appears to have been exaggerated in prior estimates, including IPCC AR5.
- Background
- 2013-2014: Cowtan & Way and Berkeley Earth analyses
- 2015: Karl et al enhancements to NOAA (and NASA) series
- Re-evaluating the “hiatus”
- 2016: Pending HadCrut4 update
In the larger sense, global warming has continued unabated in the recent period: Ocean heat accumulation, sea level rise and polar ice cap melt all continued inexorably. And the muti-decadal record in surface temperatures shows no evidence of significant change or slowdown in recent years. Nevertheless, the short-term trend in global means surface temperature has been somewhat lower than the multi-decadal trend in GMST data sets.
At the time of the release of the latest IPCC report in early 2013, there were three main global surface temperature series: HadCrut4 (from the UK MetOffice Hadley Centre in partnership with the UEA Climatic Research Unit), NOAA MLOST and NASA Gistemp. Of these only NASA GisTemp used extensive interpolation to estimate temperatures in regions without observations. (NOAA does have limited interpolation, but does not estimate temperature in missing areas in polar regions).
By 2008, controversy had arisen among climate science contrarians because of a very short-term “stop” or “pause” in HadCrut3 . A 2009 RealClimate post entitled A Warming Pause? pointed out that no conclusions could be drawn from periods as short as 10 or 11 years, and that in any event, the decadal trends in NASA GisTemp were completely in line with the longer term trend. The growing discrepancy between GisTemp and HadCrut was clearly down to the latter’s “hole in the Arctic”. HadCrut’s poor coverage in high latitudes was highlighted in Simmons et al (2009) and in Hansen et al (2010). The latter pointed out:
Thus, HadCRUT implicitly assumes that areas without observations have a temperature anomaly equal to the hemispheric mean anomaly. Given the pattern of large temperature anomalies in the fringe Arctic areas with data … this implicit estimate surely understates the effect of Arctic temperature anomalies.
In the runup to the IPCC AR5 2013 report, a new version of HadCrut featured enhanced station coverage in the Arctic, as well as an improved sea surface temperature data analysis. HadCrut4 did bring recent trends closer to NASA GisTemp, but still left a “hole” in the Arctic (albeit a smaller one). AR5 reported that 15-year trend for 1998-2012 was 0.05 ± 0.1 ºC per decade, much lower than the multi-decadal trend.
2013-2014: New analyses from Cowtan and Way and Berkeley Earth
In the two years following the release of AR5, the three traditional series were supplemented by two interpolating analyses from Cowtan and Way and Berkeley Earth.
Cowtan and Way’s original 2013 “hybrid” method used the satellite-based lower troposphere temperature record from UAH to fill in areas missed by HadCrut4, and also used a statistical interpolation technique known as kriging to estimate an average temperature “field” (thus filling any remaining gaps).
However, the original Cowtan and Way series only covered the satellite era (since 1979). So in early 2014, Cowtan and Way introduced a new “long” series back to 1850, with a “pure” krige interpolation of the complete HadCrut record. Soon after, the Berkeley Earth group released its new global temperature series based on combining the existing Berkeley land record with the ocean surface temperature data set from the Met Office Hadley Centre (i.e. the ocean component of HadCrut).
When smoothed to reflect multi-decadal variability, all five series showed a steady rise over the last 40 years with no slowdown, following a relatively flat period from 1940-1970.
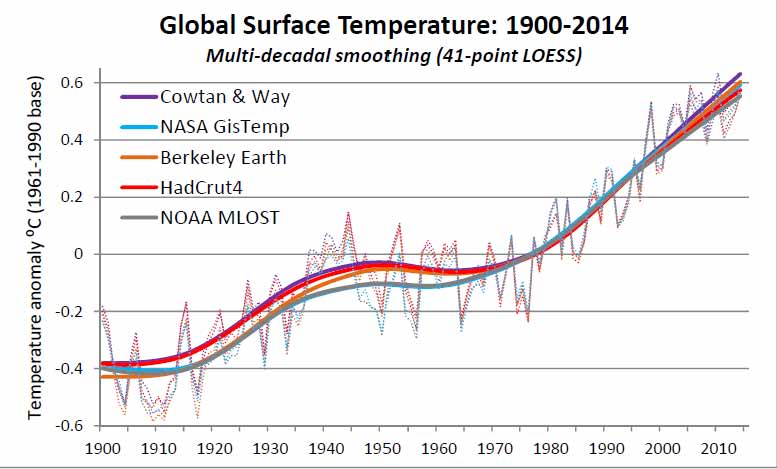
To be sure, there is some divergence even at the multi-decadal level. The three series that used interpolation to estimate regions with missing observations and provide complete global coverage (Cowtan & Way, Berkeley Earth and NASA) had a slightly higher trend over the last few decades than the two others (HadCrut4 and NOAA).
But if we turn to shorter time periods and examine decadal variability, we can see that there was an apparent slowdown starting around 2000 (as well as some more pronounced wiggles earlier on).
Although all five series showed a positive rise over the last 15 years, the three fully interpolated series had much less of a bend compared to the flatter recent trend in HadCrut4 and NOAA MLOST. This discrepancy reflects coverage bias in the latter two series.
Let’s take a closer look at the evolution of global temperature in those series, including both the “hybrid” and main “long” Cowtan and Way series (the “hybrid” series has been rebaselined to match the main series over 1979-2000).
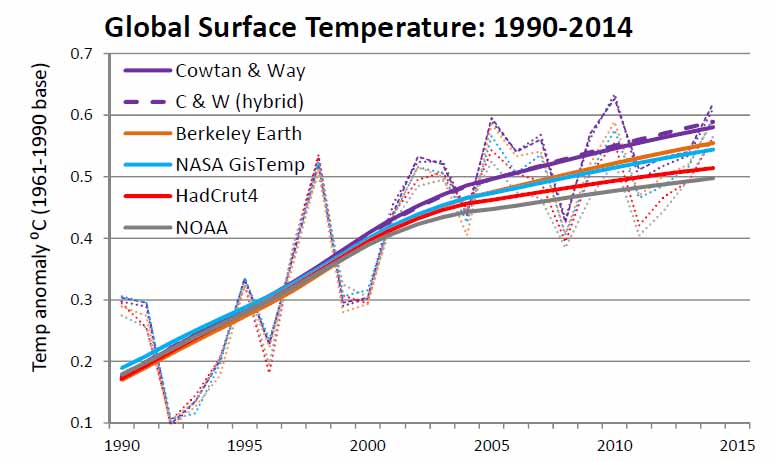
Cowtan and Way, Berkeley Earth and NASA Gistemp all use interpolation (and supplementary data in the case of the Cowtan and Way “hybrid” series) to estimate missing areas, including crucial land and sea ice regions in the Arctic. Arctic and Antarctic polar areas beyond 65⁰ latitude represent only about 9 percent of the Earth’s total surface area. Nevertheless, the recent rapid Arctic warming had a noticeable impact on the recent evolution of global surface temperature starting around 2000, partly offsetting relatively static ocean temperatures.
2015: Karl et al enhancements to NOAA (and NASA) series
Earlier this year, Karl et al released a landmark study that featured several enhancements to the NOAA analysis. The most important of these was incorporation of the improved ERSSTv4 sea surface temperature set, which corrected for biases due to differing measurement techniques. HadCrut4 had already included similar corrections across the 20th century record, but NOAA’s ERSSTv4 went further in addressing potential bias from the changing mix of buoy and ship measurements over the last decade or two.
Karl et al also incorporated a much larger land station data set from the International Surface Temperature Initiative (ISTI), thus improving station coverage. In addition to the main analysis, Karl et al also published an experimental polar interpolation series.
It is important to note, however, that only the new SST data set has been incorporated into the NOAA operational global temperature series (now dubbed NOAA GlobalTemp). The land station set remains the traditional Global Historical Climate Network (GHCN), which is planned to be replaced by ISTI in 2016. NASA Gistemp also relies on the NOAA SST data set, so it too has been updated operationally.
The following chart compares the Karl et al 2015 series and the new operational NOAA and NASA series (solid lines) with the previous operational versions (dotted lines).
NASA still has a higher recent trend than NOAA (due to polar interpolation), but both are noticeably warmer than the previous versions. The experimental NOAA “polar” series is highest of all, giving some indication of where NASA might end up once an expanded land station data set is incorporated operationally.
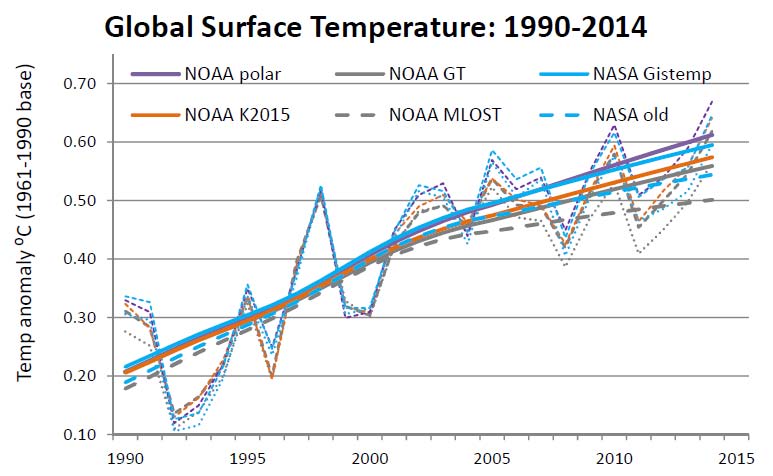
A different view of these same six series shows the effect of coverage bias more clearly.

Each same coloured pair (for example NASA Gistemp and NOAA GlobalTemp) can be thought of as representing more or less the same underlying station and SST data, with the solid lines representing a polar interpolated average, and the dotted lines the corresponding series with little or no interpolation.
Re-evaluating the “hiatus”
Until recently, HadCrut was considered the primary of the three established surface temperature analyses, in large part because it was more complete, stretching back to 1850 (NOAA and NASA both start in 1880), and also has a more comprehensive error model. Some key IPCC analyses rely mainly (or even solely) on HadCrut. But now a re-evaluation of the IPCC AR5 assessment of recent trends and associated model-observation comparisons is possible in light of the newer temperature series.
In particular, IPCC AR5 chapter 9 defined the recent slowdown as a “hiatus” characterized by a much smaller trend since 1998, compared to longer periods (and also did not note the very large statistical uncertainty of the short-term trends).
The observed global mean surface temperature (GMST) has shown a much smaller increasing linear trend over the past 15 years than over the past 30 to 60 years. Depending on the observational data set, the GMST trend over 1998–2012 is estimated to be around one-third to one-half of the trend over 1951–2012. For example, in HadCRUT4 the trend is 0.04ºC per decade over 1998–2012, compared to 0.11ºC per decade over 1951–2012. [Emphasis added; internal citations omitted]
However, adding the new interpolated global temperature series paints a very different picture.

As the following table makes abundantly clear, the supposed marked contrast between the 1951-2012 and 1998-2012 linear trends is now very much in question. In fact, the newer series show almost no difference between the 60-year trend and 15-year trend to 2012.
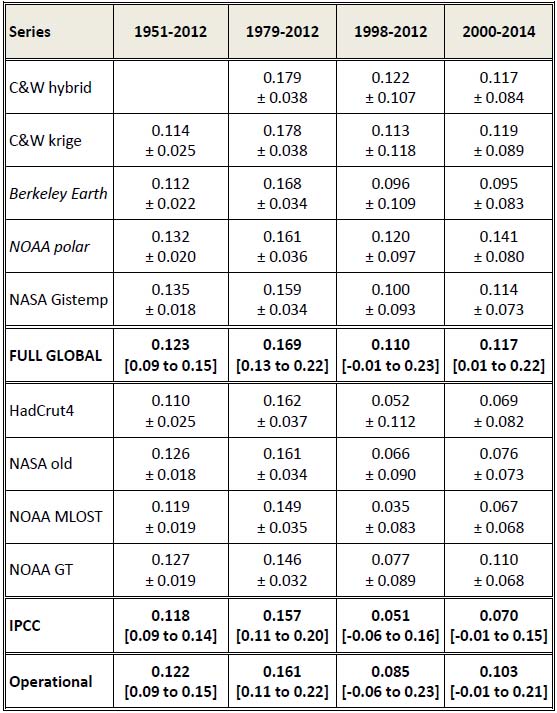 Table 1: Surface temperature linear trends in ⁰C per decade to 2012 (90% statistical uncertainty, adjusted for residuals serial autocorrelation estimated with ARMA (1, 1) model)
The following charts summarize the above in a more digestable form. The 1998-2012 trends of all the updated fully interpolated series are clustered about 0.1⁰C per decade, double the average reported by the IPCC.

We can also compare the IPCC spread to the updated operational series (Cowtan and Way now update their series every month, adding a fourth series to the three established ones). The short-term trend in HadCrut4 is noticeably lower than the other three.

To be sure, AR5 chapter 2 on observations was careful to note that 15-year linear trends have very wide confidence intervals and can reflect large swings in short-term natural variability. And they are very sensitive to even small changes in starting point: beginning in 1997 (or 1999) raises the assessed trend considerably in all series, further demonstrating that little importance can be ascribed to such very short term trends.
To overcome these and other limitations of linear trends, AR5 chapter 2 suggested the use of non-linear trend estimation techniques. Such approaches generally use a smoothed regression to evaluate temperature evolution over intervals of interest, and as pointed out in AR5, these can offer considerable advantages in characterizing variability. AR5 gave some limited examples in Chapter 2 (Observations in the Atmospheres), using a smoothed spline approach. LOESS (local estimation) regression is also a viable option and so we can generate reasonable preliminary estimates by deriving trends from the decadal smoothing shown above.
| Start year Approx. unc. (90%) | 1951 ± 0.02 |
1979 ± 0.03 |
1998 ± 0.08 |
| C&W hybrid | 0.15 | 0.14 | |
| C&W krige | 0.10 | 0.16 | 0.14 |
| Berkeley Earth | 0.11 | 0.16 | 0.13 |
| NOAA polar | 0.12 | 0.16 | 0.15 |
| NASA Gistemp | 0.11 | 0.15 | 0.12 |
| Interpolated avg |
0.10 | 0.16 | 0.13 |
| HadCrut4 | 0.09 | 0.15 | 0.11 |
| NASA old | 0.11 | 0.15 | 0.12 |
| NOAA MLOST | 0.10 | 0.14 | 0.10 |
| NOAA GT | 0.11 | 0.15 | 0.13 |
| Non-interpolated | 0.10 | 0.15 | 0.11 |
Table 2: Surface temperature LOESS trends in ⁰C per decade to 2012
In this case, only approximate uncertainties have been indicated; these tend to be in the neighbourhood of about two-thirds the linear trend case. (I will be treating the topic of uncertainty in trend estimates in detail in future posts).
In all cases, the slowdown over 1998-2012 is less pronounced than suggested by a simplistic linear trend. In fact none of the assessed trends are lower over 1998-2012 than 1951-2012, casting further doubt on the AR5 Chapter 9 definition of the “hiatus”. However, the effect of coverage bias still can be discerned, albeit somewhat less pronounced.
To sum up, coverage bias has a notable effect on the evaluation of recent surface temperature trends, especially conventional linear trends. At the time of IPCC AR5 report there was limited awareness of the full implications of coverage bias. As a result, the “hiatus” discussion in AR5 chapter 9, and cited studies such as Fyfe et al 2013, relied on a HadCrut4 temperature series that had only partially mitigated the issue.
The term “hiatus” has entered the climate science lexicon, even though the original definition is problematic. If that descriptor is to be retained, it needs to be clearly understood as referring to a moderate, short-term slowdown relative to the multi-decadal trend, not a severe reduction in the rate of GMST increase (much less a “stop” – temporary or not – in global temperature increase).
On the other hand, it is also arguable that would stretch normal usage of “hiatus” unreasonably, as James Hansen has consistently argued. And even scientists who continue to use that term concede that “slowdown” is more accurate. Here is Gerald Meehl in a recent article about the role of the Pacific Ocean in natural decadal variability:
There have been recent claims that the early-2000s hiatus (or more accurately a slowdown; the term “hiatus” will be used here to denote that slowdown), when the rate of global warming slowed compared to the previous two decades, was an artifact of problematic sea surface temperature (SST) data (Karl et al. 2015), lack of Arctic data (Cowtan and Way 2014), or both. [Emphasis added]
2016: Pending HadCrut4 update
Fortunately there are clear signs that the MetOffice will soon address the coverage bias issue. Dodd et al (2015), including HadCrut lead scientist Colin Morice as co-author, confirms that interpolation (especially kriging) provides superior estimates of Arctic surface temperature than the current HadCrut method of averaging non-empty grid cells and ignoring empty areas (“binning”).
Techniques that interpolated anomalies were found to result in smaller errors than non-interpolating techniques relative to the reanalysis reference. Kriging techniques provided the smallest errors in estimates of Arctic anomalies …
In addition, the HadCrut hemispheric averaging underweights an already suboptimal Arctic estimate; in fact, as I will show in a subsequent post, about half of the discrepancy between HadCrut4 and Cowtan and Way is down to the current simplistic averaging scheme and the other half to lack of interpolation per se. Splitting the globe into four zones rather than two hemispheres gives more appropriate weight to polar regions beyond latitude 65 , yielding a 1998-2012 trend estimate of ~0.08C per decade, instead of ~0.05. Nevertheless, the HadCrut team is to be commended for making a special effort to add station coverage in the far North, which has already partially mitigated coverage bias, and will provide an improved temperature record going forward.
In an interview and follow up with Carbon Brief earlier this year, MetOffice chief scientist Julia Slingo all but confirmed that the next major version of HadCrut will address the data gaps via some form of interpolation or optimal averaging, as well as further data “rescue”.
A paper by Cowtan & Way came up with a solution for filling in the well-known gaps in HadCrut4, particularly in the Arctic. Will the Met Office be implementing the same approach?
We are currently assessing appropriate techniques, including methods closely related to those used by Cowtan and Way. We are also interested in estimating the uncertainty in reconstructions of global temperatures as well as regions such as the Arctic, and regions that were sparsely observed early in the historical record. As well as exploring statistical techniques, we also continue to focus on gathering actual data from poorly observed regions and understanding the uncertainties of the diverse measurements that constitute HadCRUT4. Of particular interest, are those associated with changes in the way that measurements have been made over time, which are important for the assessment of decadal to centennial changes in the climate.
Slingo’s commentary is also notable for referring to very recent temperature evolution as a slowdown, not a “pause” or “hiatus”. That pattern continued in a recent MetOffice analysis that added to the growing scientific consensus that the slowdown may well have ended, as a huge El Nino continued to develop, while the Pacific Decadal Oscillation appears to have flipped from negative to positive phase.
A paper at the recent AGU conference by HadCRUT4 lead scientist Colin Morice and two other MetOffice co-authors, Nick Rayner and John Kennedy, presented the presumably imminent enhancement of HadCRUT4. Here is the abstract in full:
Incomplete and non-uniform observational coverage of the globe is a prominent source of uncertainty in instrumental records of global near-surface temperature change. In this study the capabilities of a range of statistical analysis methods are assessed in producing improved estimates of global near-surface temperature change since the mid 19th century for observational coverage in the HadCRUT4 data set. Methods used include those that interpolate according to local correlation structure (kriging) and reduced space methods that learn large-scale temperature patterns.
The performance of each method in estimating regional and global temperature changes has been benchmarked in application to a subset of CMIP5 simulations. Model fields are sub-sampled and simulated observational errors added to emulate observational data, permitting assessment of temperature field reconstruction algorithms in controlled tests in which globally complete temperature fields are known.
The reconstruction methods have also been applied to the HadCRUT4 data set, yielding a range of estimates of global near-surface temperature change since the mid 19th century. Results show relatively increased warming in the global average over the 21st century owing to reconstruction of temperatures in high northern latitudes, supporting the findings of Cowtan & Way (2014) and Karl et al. (2015). While there is broad agreement between estimates of global and hemispheric changes throughout much of the 20th and 21st century, agreement is reduced in the 19th and early 20th century. This finding is supported by the climate model trials that highlight uncertainty in reconstructing data sparse regions, most notably in the Southern Hemisphere in the 19th century. These results underline the importance of continued data rescue activities, such as those of the International Surface Temperature Initiative and ACRE.
The results of this study will form an addition to the HadCRUT4 global near-surface temperature data set. [Emphasis added]
Although enhancements to the recent instrumental record will be most welcome, MetOffice research on the earlier part of that record may prove yet more valuable. The Cowtan and Way and Berkeley Earth analyses suggest that overall warming since the 19th century has been about 10% higher than suggested by the current HadCrut4 analysis. Revised estimates of the earlier period, and even more crucially, full uncertainty estimates, will no doubt better inform observationally constrained estimates of climate sensitivity.
None of this is to say that the recent moderate short-term slowdown in GMST was completely spurious or an unworthy subject for scientific examination. Already, studies have addressed apparent discrepancies between model projections and observations, in light of recent improved understanding of the observational record as well as other factors affecting climate evolution. As I will show in subsequent posts, the most compelling of these find little evidence of model-observation divergence beyond what would be expected from internal natural variation, so long as there is a proper accounting of coverage bias and updated forcings.
Meanwhile, the current strong rise in all the surface temperature records is also characterized by increasing convergence between the various operational data sets, coverage bias or no. I will look at this phenomenon in part 2 in a short while, but for now, I will end with a preliminary look at the recent evolution of the four major operational series (all except Cowtan and Way are updated to the end of 2015).
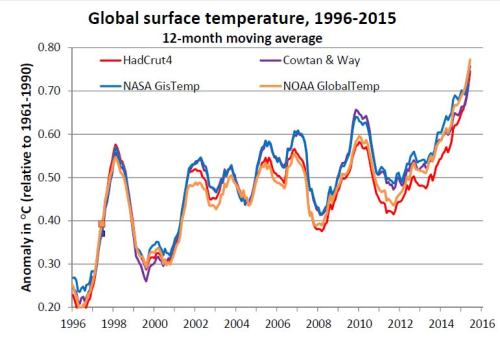
All the analyses agree: it’s getting very warm and 2015 was by far the warmest year in the instrumental record.
Temperature series references and links
Cowtan, K. and R.G. Way, 2013: Coverage bias in the HadCRUT4 temperature series and its impact on recent temperature trends. Quarterly Journal of the Royal Meteorological Society, Volume 140, Issue 683, pages 1935–1944, July 2014 Part B [link] [Cowtan and Way overview page]
Hansen, J., R. Ruedy, M. Sato, and K. Lo, 2010: Global surface temperature change, Rev. Geophys., 48, RG4004, doi:10.1029/2010RG000345. [link] [GISS Surface Temperature Analysis (GISTEMP)]
Karl, T. R. et al., (2015): Possible artifacts of data biases in the
recent global surface warming hiatus, Science, June 4 2015, doi:10.1126/science.
aaa563. [link] [study data] [NOAA Global Surface Temperature Transition]
Morice, C. P., J. J. Kennedy, N. A. Rayner, and P. D. Jones, 2012: Quantifying uncertainties in global and regional temperature change using an ensemble of observational estimates: The HadCRUT4 dataset. J. Geophys. Res., 117, D08101, doi:10.1029/2011JD017187. [link] [HadCrut4]
Rohde, R., R. A. Muller, et al, 2013: Berkeley Earth Temperature Averaging Process. Geoinfor Geostat: An Overview 1:2. doi:10.4172/gigs.1000103 [link] [Berkeley Earth Land and Ocean]
Smith et al., (2008): Improvements to NOAA’s Historical Merged Land-Ocean Surface Temperature Analysis (1880-2006), J. Climate., 21, 2283-2293. [link] [NOAA Climate at a Glance]
Other references
Dodd, E.M.A., C. J. Merchant, N.A. Rayner, and C.P. Morice, 2015: An Investigation into the Impact of using Various Techniques to Estimate Arctic Surface Air Temperature Anomalies. J. Climate, 28, 1743–1763. doi: http://dx.doi.org/10.1175/JCLI-D-14-00250.1 [link]
Flato, G., J. Marotzke, B. Abiodun, P. Braconnot, S.C. Chou, W. Collins, P. Cox, F. Driouech, S. Emori, V. Eyring, C. Forest, P. Gleckler, E. Guilyardi, C. Jakob, V. Kattsov, C. Reason and M. Rummukainen, 2013: Evaluation of Climate Models. In: Climate Change 2013: The Physical Science Basis. Contribution of Working Group I to the Fifth Assessment Report of the Intergovernmental Panel on Climate Change [Stocker, T.F., D. Qin, G.-K. Plattner, M. Tignor, S.K. Allen, J. Boschung, A. Nauels, Y. Xia, V. Bex and P.M. Midgley (eds.)]. Cambridge University Press, Cambridge, United Kingdom and New York, NY, USA. [PDF]
Fyfe, J.C., Gillet and F. Zwiers, 2013: Overestimated global warming over the past 20 years. Nature Climate Change 3, 767–769. doi:10.1038/nclimate1972 [link]

Great piece!
The link for, paper at the recent AGU conference, is not working.
Thanks for reading to the end! The link has been fixed now.
Welcome back!
I concur: welcome back!
I quibble some with the phrase in the lead paragraph’s 2nd sentence, “without any assist from the El Nino weather pattern that usually accompanies such warm years.” According to a graph in a Weather Underground article released today (by Jeff Masters and Bob Henson), a couple of months in 2014 had “conditions similar to El Niño”. At least one agency declared that an El Niño started in 2014, but a resetting of the ‘average background’ (or something like that) reversed the declaration. (This ‘average background’ keeps going up due to AGW, of course.) I’d rather have seen you use a phrase similar to “without a full-blown El Nino, the weather pattern that usually accompanies such warm years.” This said, your article focuses on coverage bias and what scientists have been doing to see what is happening more clearly, so my ‘quibble’ is not relevant to your main thesis.
Actually, I think the “resetting” was the change in ERSST from v3 to v4.
Be that as it may, it’s true that ONI was in El Nino territory (ONI >= 0.5) for the last couple of months of 2014. But it was in La Nina-ish (ONI <= -0.5) early on, and overall ONI was 0 for the year. Not only that, but global temperature usually lags ENSO by 3-4 months, and the last 3 months of 2013 saw a slightly negative ONI. So on balance I would say there was very little if any overall ENSO effect in 2014. 2015 definitely received a boost (like 1997), but the full effect should only be reached this year (as in 1998).
“…a relatively flat period from 1940-1970.”
Was there, really? Or did a prodigious warm anomaly in the 1940s make it appear so? If one removes that big spike from the record, the following years look not that far off the ascending trend:
http://theconversation.com/the-hottest-year-on-record-signals-that-global-warming-is-alive-and-well-53480
DC, has anyone tried applying coverage bias to model output? i.e. remove temperature records where we can’t measure them on the surface, and fill in the blanks with the same methods they’ve used with surface data.
Cowtan and Way cross-validated in a number of ways, including reanalyses. Morice et al from the UK Metoffice have validated their new methodologies against CMIP5 model output (see AGU abstract above). As far as I know, they are the first to do this.
Nice to see you posting again, DC.
As 1998 moves down the list of hottest years, it gets harder to claim that “global warming stopped in 1998.” But I expect the meme to continue for a while yet.
It was obvious to anyone who was even slightly statistically savvy that the hiatus was likely due to statistical variability and when Cowtan and Way showed the underestimate of Arctic warming much of that disappeared too. The increasingly warm western Pacific (exemplified by Typhoon Haiyan) largely explained where the extra heat was going. So it’s no surprise that we now have a super El Nino and the record world surface temperatures. As the greenhouse gas forcing was increasing, how could the temperature stop rising?
Events in the Arctic, especially the melts in 2007, 2010, 2011, and 2012 showed the effects of continued warming. I wonder what we’ll see there in 2016 and, particularly, 2017, when this El Nino heat gets into the Arctic.
Syd Bridges: Repeat after me… “Global Warming stopped in 2016.” That is the new mantra.
DC: I’m just curious to see what the data sets looked like, and I think it would be interesting to observe what the model output looks like if we introduced observation bias. I had seen a one model output with the poles removed and they had a decidedly flat hiatus in them.