
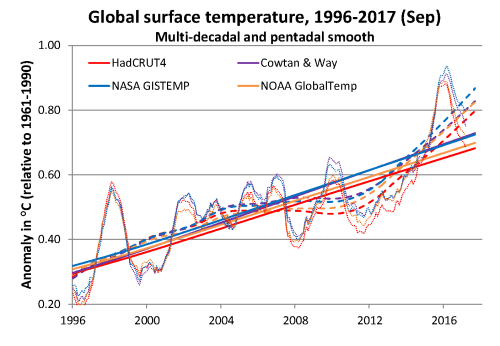
The recent synchronized update of all four of the most closely followed temperature series (along with the buoy-based SST series from our 2016 paper, Hausfather et al) has inspired a long overdue surface temperature update. First I’ll look at the four global temperature series over the last 35 years, and then examine 2017 in the context of recently identified biases in GMST records.

The long-term trend is quite similar in all four data sets (albeit slightly higher in the two full global series). We can also see in all four series a qualitatively similar short-term slowdown in the 2000s (although much more pronounced in HadCRUT4 than the others), followed by the recent surge.
However, we can also see that the 12-month running average continues to drop off, as ENSO-neutral conditions in the Pacific have given way to a weak La Nina (indeed, the period from late 2016 to present is probably best thought of as a weak “double dip” La Nina). Nevertheless, all four global temperatures are still running above the long-term trend. So 2017 may well turn to be not only the warmest La Nina year on record, but the first to actually remain above the long term rising trend over the last 40 years, at least in the full global series.
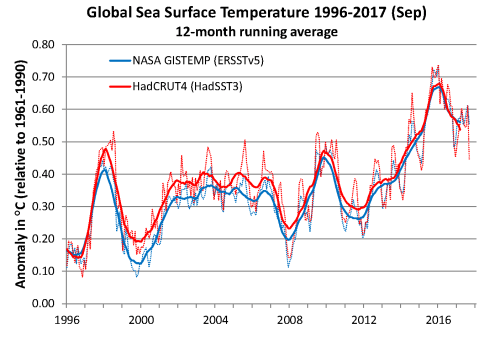
It is also worthy of note that the gap in the 12-month running average between the warmest series (NASA GISTEMP) and the coolest (HadCRUT4) has now reached more than 0.1C when assessed relative to the 1961-1990 baseline.
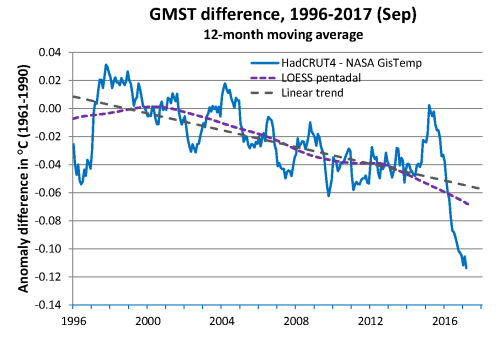
This large gap in the recent period is driven by an apparent double cooling bias in the HadCRUT4 data set, namely coverage bias and SST ship-buoy bias. Both of these have been very much in evidence in 2017.
Coverage bias
As noted in previous posts, the last 20 years have been characterized by increasing divergence between the full global series (NASA GISTEMP and Cowtan & Way) and the corresponding non-interpolated series (NOAA GlobalTemp and HadCRUT4), primarily from the latter’s failure to account for rapid warming in the Arctic.
But this divergence has not been monotonic. As I noted earlier this year, the short-lived convergence between all four series in 2015 was followed by a swift return to strong divergence in 2016. That large gap between full global and reduced coverage series has continued or even grown a little through 2017.
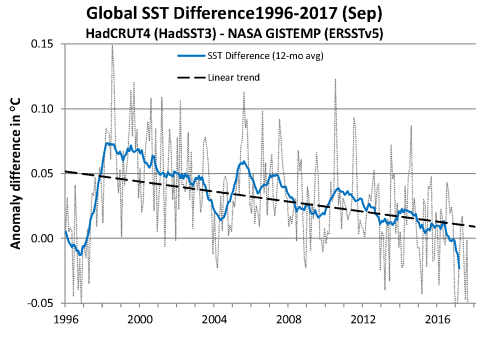
The difference between full global and non-interpolated series appears to be about ~0.07C over the last 12 months. But as we saw above the total gap between NASA GISTEMP and HadCRUT4 has widened and is more than 0.1C. This additional difference reflects the growing gap between the two underlying SST series, ERSST and HadSST respectively.
SST bias in the recent period
ERSSTv5 Update
As I mentioned earlier this year, the four data sets I follow most closely can be thought of as forming a rough matrix based on underlying data sets, and interpolation approach.

Although coverage bias accounts for most of the differences in short-term trends, differing SST data sets also results in about ~0.02 C per decade lower trend in the HadSST-based series (Cowtan and Way and HadCRUT4) relative to the corresponding ERSST based series (NASA GISTEMP and NOAA GlobalTemp) over the last 20 years, as seen in my last update to the end of 2016.
Before showing the 2017 update, I’ll take a slight detour to note a recent change in ERSST. A couple of months ago, NASA announced the use of NOAA ERSST v5 (instead of v4) for all subsequent data updates, starting with the update to the end of July. NOAA plans to switch over early in 2018 coincident with a planned move to version 4 of the GHCN station database; meanwhile, both SST versions are operational and are being updated each month.
This means that the underlying sea surface temperature data series are slightly different in NASA GISTEMP and NOAA for now. But unlike the move from ERSSTv3b to ERSSTv4, this latest update makes very little difference to global temperature in NASA GISTEMP.
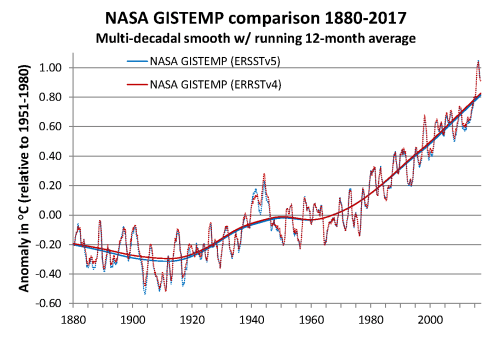
The long-term comparison shows minimal difference with a slight dip in the new series in the early part of the record and an almost imperceptibly lower trend in the rise over the last 40 years.
Turning to the recent short-term trend, we can see some divergence from 1990, with the new version slightly lower for much of the period, but catching up in the last couple of years.
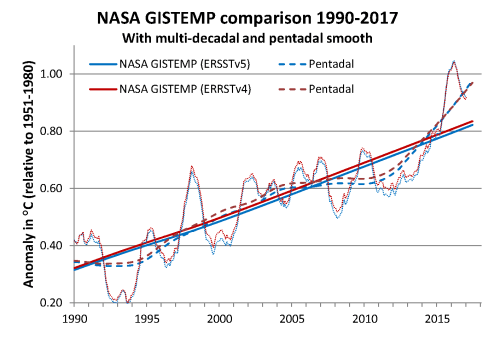
The short-term 15-year linear trends are almost identical: over 1991-2005, the newer ERSSTv5-based series is slightly lower (0.25 C per decade versus 0.26), but is slightly ahead over 2003-2017 (0.22 versus 0.21). The 15-year pentadal LOESS based trends show similarly small differences.
Updated ERSST and HadSST comparisons
As one might expect then, the difference in the recent trends between ERRSTv5 and HadSST3 is still very much in evidence. And that difference apparently grew in 2017.
Next I’ll compare the two SST series to the buoys-only record first published in Hausfather et al, now updated to September 2017. Recall that our 2016 paper identified residual cool bias in HadSST3 when compared against instrumentally homogeneous SST records based on buoys or satellite observations over the last 20 years. This buoys-only series has been interpolated to match ERSST coverage, so I have also masked the series to match HadSST3 coverage to produce the “BuoysMask” series.
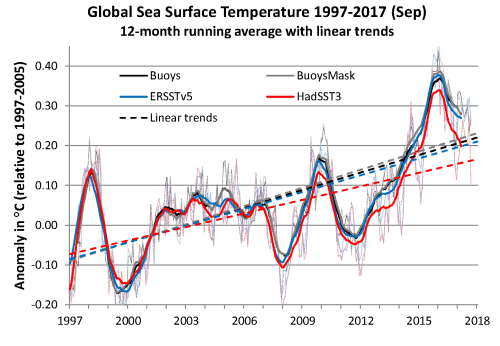
The corresponding difference series show that ERSSTv5 agrees very well with the buoys-only record, while HadSST3 strongly diverges from it.
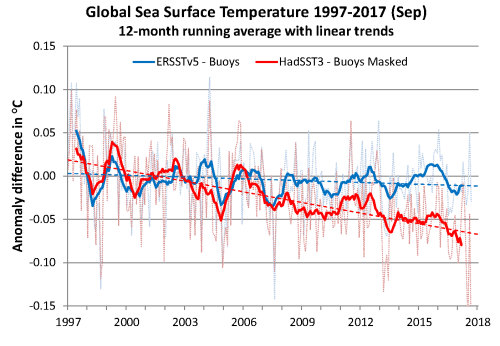
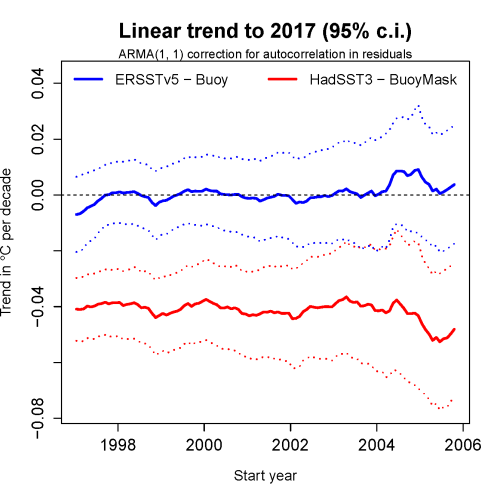
The linear trend in differences with the buoys record over 1997-2017 is negligible for ERSSTv5 (-0.007 ± 0.015 ºC per decade), but pronounced for HadSST3 (-0.04 ± 0.01). Overlapping linear trends obtained by varying the start date from 1997 up to 2005 demonstrate the consistency of this apparent cool bias in HadSST3.
Concluding remarks
2017 shows continued coverage and SST biases in GMST series over the past two decades, with both biases evident in the HadCRUT4. Coverage bias of course has been widely discussed in the literature, with confirmation via comparison with independent reanalyses (Dodd et al, 2015) and most recently a new in-situ Arctic record (Huang et al, 2017). Indeed, the Royal Society’s recent climate update has acknowledged that improved understanding of “observational biases” related to the Arctic implies a greater rate of surface warming than stated in IPCC AR5 during the “temporary slowdown” of 1998-2012. The SST ship-buoy bias is less well documented but updated observations demonstrate its continued effect. The SST bias effect is not as strong as that of bias coverage over the last 20 years, but is steady over this interval.
Quantification of these two biases and estimation of their combined effect would require more rigourous cross-comparisons beyond the simple comparison of available data sets as above. I’ll explore this further in subsequent posts, and hopefully in eventual publication. In the mean time, best estimates of recent short-term trends should take these biases into account as much as possible. Certainly the use of HadCRUT4 as a sole or main estimate of recent short-term trends, or trends over the last 30-60 years for that matter, is ill-advised.
Having said that, the effect of coverage bias on the full instrumental record back to the 19th century is less clear. Coverage bias does affect centennial trends, but the impact of sub-optimal averaging on the sparser data sets in the early part of the record is not well understood. As for SST, there are important differences between ERSST and HadSST in the era before 1995 and there is some evidence that HadSST may well be more accurate up until then. For now, longer term evaluations (for example assessment of global warming to late 20th century relative to a pre-industrial baseline) should treat HadCRUT4 as a likely lower bound among a range of available observational estimates. In time more optimal averaging schemes (whether implemented by the NOAA and the Met Office themselves, or the wider climate science community) may well raise that lower bound.
Unfortunately some researchers continue to use HadCRUT4 as the main or even sole observational estimate. An example of this is the recent controversial paper from Millar et al, who re-evaluated the available carbon budget to keep warming below 1.5C. While much of their analysis does have merit, their main projection of current and future warming under aggressive mitigation is clearly low when compared to the full range of operational observations and the transient climate response implied therein.
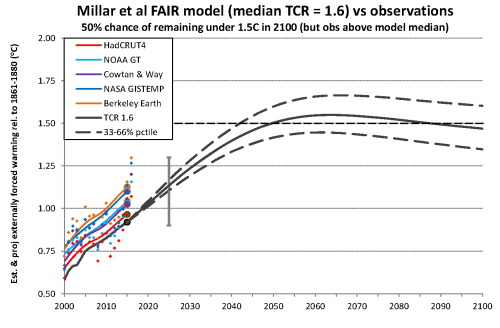
In a future post (and perhaps more formal publication eventually), I’ll propose some suitable additions, corrections and revisions to Millar et al and related papers published by the Environmental Change Institute climate science group at Oxford University.
[All data sets downloaded November 7-8, 2017 (except previous version of NASA GISTEMP, downloaded late July, 2017). For GMST data sources and associated references, see the data sources page.]
[Update December 15: The first paragraph of the Concluding Remarks has been updated to add references to Dodd et al and Zhang et al, along with the summary of improved understanding concerning the 1998-2012 temporary slowdown since the IPCC AR5 report].
