
 2018 was the fourth warmest year in the global surface temperature record, according to year end updates from NASA, NOAA and the UK MetOffice, albeit somewhat cooler than the 2016 peak. This continues a string of record or near-record annual temperatures, with the top four occurring in the past four years.
As in my previous updates (see here and here), I’ll provide some additional context, highlighting the issue of coverage bias and ongoing Arctic warming. Series that use statistical methods to account for areas with few or no observations, especially in the Arctic, continue to diverge markedly from those with little or no interpolation. Recent observations also show the emergence of a seasonal pattern in Arctic warming, an important aspect of coverage bias that has been less explored thus far. In addition, the last decade or so has seen the emergence of ship-buoy SST bias, first identified in a key 2015 paper from NOAA and confirmed in our 2016 paper.
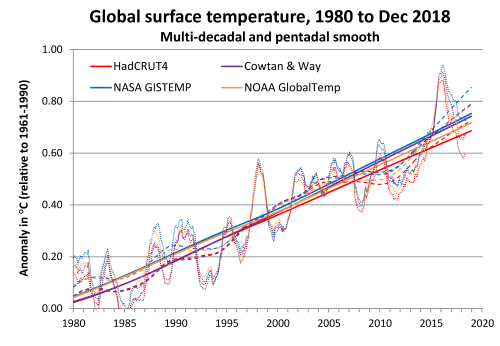
To start, here are the four surface temperature series I have been tracking over the last while, all of which show a strong rise since 1980, albeit with short-term fluctuations around the long-term trend.
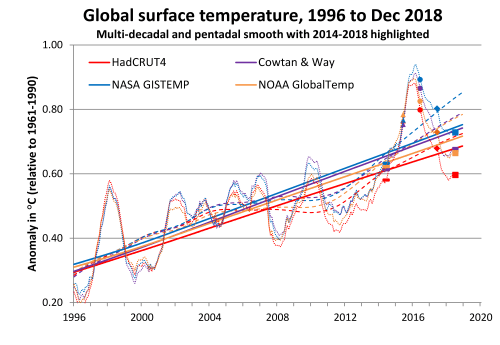
A closer look highlighting the last five years shows a surge up to a peak in 2016. Global temperatures have abated since then, as the 2015-16 super El Nino gave way to a double dip La Nina; nevertheless current GMST remains above pre-2014 levels. Note also that the spread between the four series has continued to widen, continuing a tendency I noted last year.
Coverage bias
Recall that the four temperature series I cover regularly can be viewed as a 2×2 matrix according to the underlying data sets and the use of interpolation to address coverage bias.

Thus to evaluate the effect of interpolation on recent GMST trends, HadCRUT4 is compared to Cowtan & Way, and NOAA GlobalTemp is compared to NASA GisTemp. In general, strong Arctic warming has resulted in large differences between the series featuring full polar interpolation and those with no polar interpolation. The non-interpolated series implicitly set missing Arctic (and Antarctic) areas to the hemispheric or global average of observations, while statistical interpolation fills in missing areas with more physically plausible values, weighting nearby observations more strongly. The UK Met Office explains:
In 2018, Arctic temperatures were below those of 2016 but still unusually high in the longer-term context, exceeding anything recorded prior to 2005. The Arctic average was considerably higher than the average for the rest of the globe so the data sets with sparser coverage in the Arctic will – all else being equal – tend to underestimate the global average temperatures in recent years including 2018.
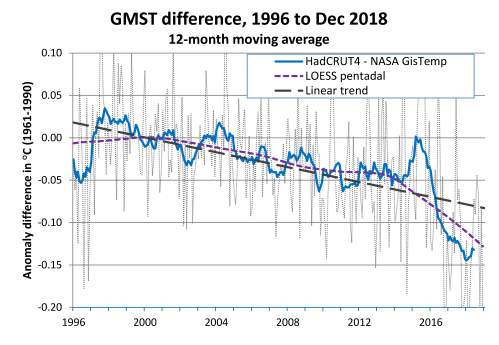
Indeed, the respective difference series do show a growing gap over the last 20 years, although the evolution of the divergence is decidedly jagged.
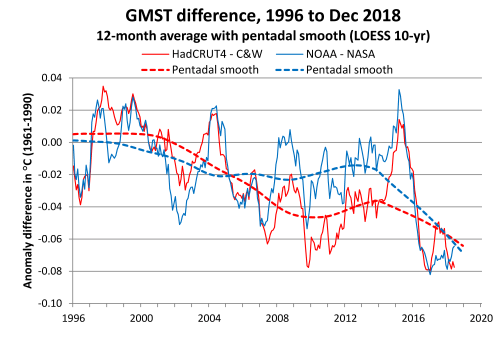
Both difference series showed a sharp descent over 2015-2016; the two non-interpolated series have remained ~0.06 °C below the respective interpolated series over 2017-2018 (relative to 1961-1990 baseline).
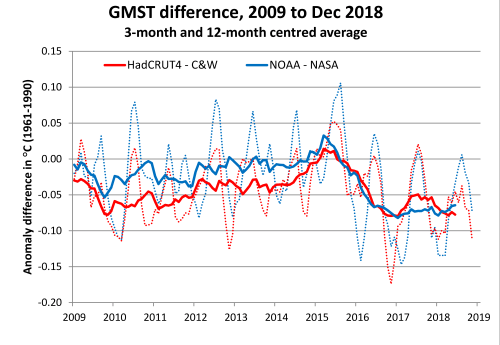
In recent years, a fairly consistent seasonal pattern to these differences has emerged. The greatest difference is typically seen in the boreal winter, often in December or January, while the middle of the year shows minimal difference.
 As I will show in a subsequent post, this pattern can be traced to recent strong warming in the Arctic winter (relative to historical climate). This results in a greater differential in the overall average between interpolated and non-interpolated series during those months. In contrast, June and July typically see much less difference between the Arctic and the rest of the globe, and any remaining difference is typically offset to some extent by cold Antarctic temperature anomalies.
Ship-buoy SST bias
In my last update, I noted that an apparent ship-buoy cool bias in HadSST also plays a role in series differences in recent years. The UK Met Office has now acknowledged this additional source of discrepancies in the latest update.
… NOAA adjust their data so as to remove an artificial drop in sea-surface temperatures measured by ships since the early 2000s. The adjusted sea-surface temperature data are used in both NOAAGlobalTemp (using version 4) and GISTEMP (using version 5). This adjustment is not applied in the Met Office Hadley Centre analysis, HadSST3, which is used in HadCRUT4, CW and the Berkeley Earth analysis and could explain some of the differences.
The HadSST based series (Cowtan & Way and HadCRUT4) have warmed somewhat less since 2005 than the corresponding ERSST based series (NASA GISTEMP and NOAA GlobalTemp). Over that period, the ERSST series is more in line with the homogeneous buoys-only data set first published with our 2016 paper and since updated through to the end of 2017 (the 2018 data should be available later this year).
Thus, some indication of the combined effect of coverage bias and ship-buoy bias over the last two decades can be seen in the difference between HadCRUT4 and NASA GISTEMP over that period.
 This comparison suggests a combined potential cool bias of close to -0.05°C per decade in HadCRUT4. However comparisons between these two series may also be affected by other factors, such as differing land-based station observation datasets.
One approach to assessing the combined biases would be to construct two new series that substitute the buoy dataset for HadSST in each of HadCRUT4 and Cowtan and Way, leading to the following comparison matrix.

In each case, “pure” SST grid cells (i.e. with no coastline or islands present) are replaced by the corresponding buoy grid cell value. As expected, this results in higher trend over 1997-2017 for the two buoy SST series compared to their HadSST based counterparts.
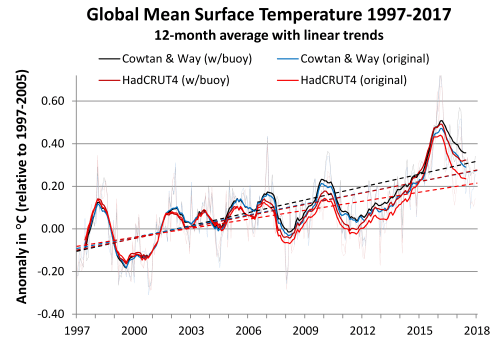
Here are the linear trends in °C per decade for each series (95% uncertainty with ARMA(1, 1) correction for autocorrelation in trend residuals).
| Series | w/ Buoy SST |
w/ HadSST3 |
| Cowtan & Way | 0.20 (± 0.10) | 0.17 (± 0.10) |
| HadCRUT4 | 0.18 (± 0.11) | 0.14 (± 0.11) |
This implies about -0.06 °C per decade combined cooling bias in HadCRUT4 over the last two decades. The trend in differences between CW-buoy and HadCRUT4 over 1997-2017 is -0.06 (±0.02) °C per decade. Note that coverage bias was more prominent up to about 2012, while the ship-buoy bias has come increasingly to the fore during the recent surge. Once the buoy-only dataset has been updated to the end of 2018, I’ll provide a further update and also explore potential implications for multi-decadal trends.
In this and other updates, I have focused on trends since 1980, in the main comparing multi-decadal and pentadal trends to explore recent short-term fluctuations around the underlying steady trend. But non-linear multi-decadal trends also provide optimal characterization of longer-term temperature evolution.
So in part 2, I’ll focus on the estimates of global warming relative to the last half of the 19th century. As a preview, here is a chart of long-term GMST evolution relative to 1850-1900.
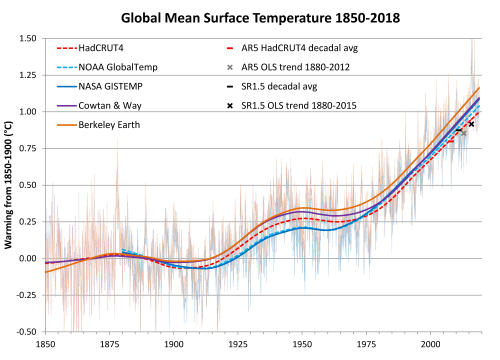
LOESS multi-decadal trends are shown for five operational series (note the addition of Berkeley Earth to the four others), along with warming estimates from IPCC AR5 and the recent IPCC Special Report on Global Warming of 1.5 °C (SR1.5).
The three series with near-complete global coverage are shown as solid lines; their gap with the lone non-interpolated series (HadCRUT4) has reached ~0.1 °C. This demonstrates the importance of coverage bias in the evaluation of long-term trends. But it is also appears that the IPCC methods severely underestimate observed global warming, especially the OLS linear trend estimates, which are at the very low end of the corresponding observational series.
Links to all temperature data sources (and associated papers) can be found at the data sources page. Land-ocean data sets were downloaded 2019-02-13, except Berkeley Earth downloaded 2019-01-24.

In addition, the last decade or so has seen the emergence of ship-buoy SST bias, first identified in a key 2015 paper from NOAA
Perhaps you meant something narrower than this, but ship-buoy SST bias was identified decades before this. Here’s a paper from 1990 reporting the same ~0.1ºC mean difference that is found today. Adjustment for it has been a long time coming.
Also, I’m not sure if you meant to imply that HadSST3 doesn’t adjust for ship-buoy difference, but it does, as outlined in this description. It appears that the difference between HadSST3 and ERSSTv4/v5 is a bit more complicated, perhaps primarily due to inadequate recent ship-ship adjustments in HadSST3. As I understand it the HadSST3 bias adjustment is based on metadata and identification of specific measurement types and, unless there has been an update not shown anywhere, I believe their metadata only extends to 2006.
A final point, which seems to have gone under the radar, is that the large divergence since about 2016 is actually not specific to ERSSTv5-HadSST3. It is also seen against ERSSTv4. In fact, while initially tracking the ERSSTv4 divergence, HadSST3 reverses back towards ERSSTv5 at the start of 2018. This coincides with a documented move (see top of page) to ERDDAP as the source of drifting buoy data following a decline in ICOADS drifting buoy data since November 2016.
Also shown on that last graph was the difference between ERSSTv5 and satellite (AVHRR-only) OIv2 data. My understanding is that this should be somewhat independent from in-situ datasets, yet it too shows a very similar large divergence against ERSSTv5 from 2016. Though I think some of the satellite SST datasets do use buoy data for things like drift correction, not sure of the specifics in OIv2.
I contacted Boyin Huang about this and he just said adjustments are different in ERSSTv5 so some difference compared to v4 is expected. But I think the divergence since 2016 is large enough, unusual enough, to require a more specific explanation. It could be that the divergences are largely some kind of artifact from the decline in ICOADS drifting buoy data, as documented on the HadSST3 page, with ERSSTv5 being unaffected due to the large amount of additional data of other types (e.g. Argo), but I think it’s worthy of deeper investigation.
First of all I’m very sorry to have missed your comment for so long. My sincere apologies.
You are right to suggest that “ship-buoy bias” in HadSST3 is an issue beyond the fact that buoy measurements are generally lower than ship ERI measurements (~0.12C cooler on average). HadSST3 has a relatively constant offset between ship and buoys and in general assumes that no corrections to ship measurements were needed after the 1940s. But in fact the ship warm bias has changed over the “modern” period, especially after 2005. Buoys show more warming over 1997-2018 than the unadjusted ship measurements. In contrast, ERSSTv4 and v5 continue ship corrections right up to the present and now so does the newly released HadSST4.
I had also noticed some slight differences between ERSSTv4 and ERSSTv5 based on the difference in NASA GISTEMP when changing SST versions (see my previous post). ERSSTv5 was below ERSSTv4 for most of the 2000s, but ERSSTv5 had caught up and was starting to move ahead by the end of 2017.