Monthly Archives: August 2012

2012 Arctic sea ice minimum, part 2: September 2012 projected at 3.6 million sq km, 700K below previous low in 2007

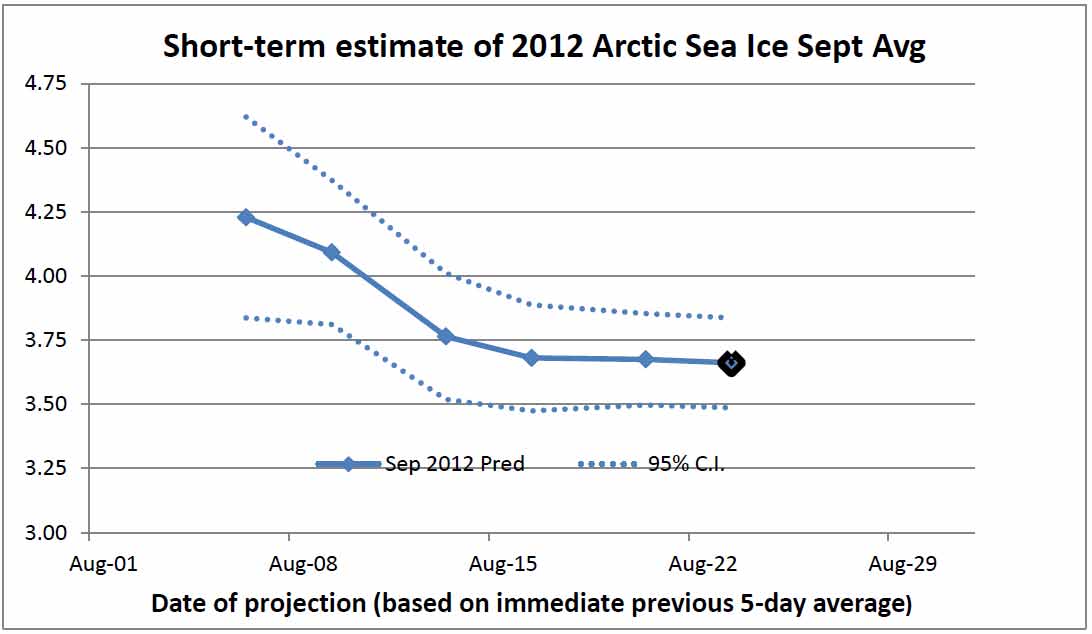
Interest in 2012’s record  Arctic sea ice melt has reached the mainstream press both here in Canada (CBC, PostMedia) and abroad (New York Times, Associated Press and the Guardian), now that the Colorado-based National Snow and Ice Data Center (NSIDC) has declared a record low in Arctic sea ice extent.

In my previous discussion of the extraordinary 2012 melt, I noted the eclipse of the old daily record on August 24, three weeks ahead of the 2007 pace. But I also gave a series of short-term  projections for the September extent average, which is the metric typically used to track the decline in Arctic sea ice. The  2012 September projection now stands at 3.56 million sq km, slightly down from my previous projection of 3.67 million sq km. That’s more than 700,000 sq km less than the previous 2007 record of  4.30 million sq km.

Continue reading

2012 Arctic sea ice minimum, part 1: A new record low

[UPDATE Aug 24-28: The previous record low for daily Arctic sea ice extent was 4.16 million sq km, set on September 14, 2007. The new record was first set on August 24, 2012 and now stands at 3.85 million sq km. Sea ice extent was reduced by more than 430,000 sq km in five days (Aug 23-27), the most rapid late August loss on record. Click on thumbnail at right for latest Arctic sea ice extent as of today (based on latest NSIDC daily data).

August, 2012:

  • Aug 22: 4.29 million sq km
  • Aug 23: 4.19 million sq km
  • Aug 24: 4.09 million sq km ***
  • Aug 25: 3.97 million sq km
  • Aug 26: 3.94 million sq km
  • Aug 27: 3.85 million sq km

*** New record low for daily Arctic sea ice extent set on  Aug 24.]

This year’s arctic ice melt season is generating extraordinary interest. 2012’s apparent descent toward a new record low in extent and area is dramatic enough, but it also comes as new analysis shows that summer sea ice loss is 50% more than previously thought in terms of volume, according to preliminary satellite data from CyroSat 2. Virtually ice-free summers in the arctic sea could well arrive by 2030, with troubling implications for accelerated albedo feedback and possibly disruptive changes in the jet stream.

A new record low, eclipsing 2007, does seem increasingly inevitable with each passing week. National Snow and Ice data Center data showed Arctic sea ice extent at 4.29 million square km yesterday, just under 2007’s September average, and a level only reached on September 7 back then. To be sure, 2012 is starting to bottom out, but most years have seen a similar pattern around now.

Here’s a snapshot of the  2012 melt season (with the small crosses denoting recent daily values), compared to the previous five years.

Just how low could 2012 go?

Continue reading

Berkeley Earth, part 1: Divergences and discrepancies

[UPDATE 08/17: In comments, Berkeley Earth team member Zeke Hausfather reveals that most of the discrepancy between the Berkeley Earth 2011 and 2012 results is due to a previously unreported error in latitudinal weighting in the earlier version.

UPDATE 08/20: The 2012 GHCN-only series has been uploaded by Zeke Hausfather. Also, I have added clarifications concerning absolute temperature uncertainty and data availability. The summary has been updated accordingly.]

The recent Berkeley Earth land-surface average temperature series is based on a greatly expanded database of station temperature data, along with a completely automated statistical averaging process. In contrast, established average temperature series from NOAA, NASA and HadCrut are based primarily on the smaller Global Historical Climate Network (GHCN) database, and use empirically derived homogenization methods to remove known biases, albeit supplemented by pure statistical methods.

Here, the post-1950 Berkeley Earth “complete” land series is compared to the preliminary Berkeley series released in 2011, as well as to GHCN-only simulated series, based on overall attributes of those unreleased series provided in the Berkeley Earth companion “methods” paper. The 2011 and 2012 “full” (ALL) series Berkeley versions both fall squarely in the range of the latest comparable series from the three other groups post-1950. However, the two Berkeley ALL series diverge over the 1980-2010 period, and lie completely outside each others’ 95% confidence intervals in the 2000s, when baselined to 1950-1979. This turns out to be due to a significant error in latitudinal weighting in the 2011 ALL series; the error was not publicly disclosed at the time of correction. The GHCN 2012 series falls halfway between the 2012 ALL and 2011 ALL series in the 2000s; 2012 GHCN and 2012 ALL each appear to diverge outside the other’s confidence interval in the 2000s. As well, there is an increasing widening between the 2012 GHCN and ALL  series the further one goes back before the 1950-1979 baseline period, with the ALL series about 0.3 C cooler in the early 1800s.

Other issues requiring further analysis are also identified, particularly a reported reversal in the long-term trend of narrowing diurnal temperature range starting in 1987, which contradicts previous GHCN-based analyses.Taken together, these issues cast doubt on the robustness of the present Berkeley Earth analysis, and point up the need for more open data access and improved diagnostics in order to further assess the reliability of the Berkeley Earth approach to surface temperature analysis.

Continue reading

Open Thread, August 2012

This month we kick things off with the renewed attacks on Tides Canada by oilsands booster (and Canadian Conservative government surrogate) Ethical Oil [h/t Holly Stick].

Meanwhile, Canadian environment minister Peter Kent is touting an improved outlook for meeting Canada’s 2020 goal for GHG reduction, even though any progress is more due to luck, accounting changes and strong action by some provincial governments, rather than any concrete action by the federal government. Not to mention that current projections for 2020 still leave Canada only 3% under 2005 levels, 19% above the promised target. I’m working on a couple of related posts, but they may take a little time yet.

The latest release from the Berkeley Earth team has unleashed a major kerfuffle in the blogosphere, out of all proportion with its scientific import. (By the way, I have a post on Berkeley Earth coming very soon, looking at some curiosities in the various Berkeley results).

Getting back to the science, arctic sea ice continues to melt at an extraordinary pace, and may well set a new record low this September.