
 Interest in 2012’s record Arctic sea ice melt has reached the mainstream press both here in Canada (CBC, PostMedia) and abroad (New York Times, Associated Press and the Guardian), now that the Colorado-based National Snow and Ice Data Center (NSIDC) has declared a record low in Arctic sea ice extent.
In my previous discussion of the extraordinary 2012 melt, I noted the eclipse of the old daily record on August 24, three weeks ahead of the 2007 pace. But I also gave a series of short-term projections for the September extent average, which is the metric typically used to track the decline in Arctic sea ice. The 2012 September projection now stands at 3.56 million sq km, slightly down from my previous projection of 3.67 million sq km. That’s more than 700,000 sq km less than the previous 2007 record of 4.30 million sq km.
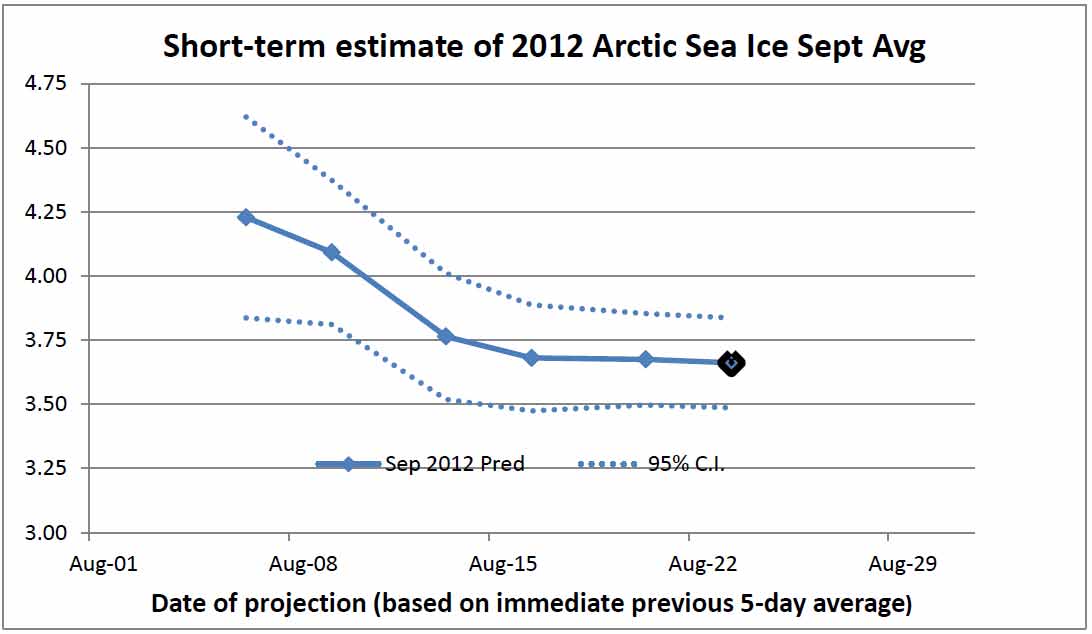
As I discussed in greater detail last time out, these short-term projections are generated by regressing the most recent 5-day sea ice extent level against the eventual September average. This seems to give a very reasonable result, once one is past the first week of August or so. Here are four such projections, with the latest (purple circles) based on the five-day average for August 22-26.

This gives a September 2012 projection of 3.56 +/- 0.13 million km (as seen in the lower right hand corner), down slightly from the previous week. Here is the whole series to date.

The confidence interval continues to tighten; past projections based on August 27 have correlation of coefficient of about 0.98. The resulting tight forecasts can be seen in the model’s simulated past projections for August 27.

Arctic sea ice continues to melt at a record pace (yesterday’s daily level was at 3.8 million sq km), so the next projection update may be slightly lower. The eventual level will depend largely on when the minimum is actually reached; recent years’ five-day minima have ranged from early September (e.g. 2010) to late September (e.g. 2011). But at this late stage, I would be surprised if the 2012 September average went below 3.4 million sq km (or above 3.7).

I’ll not only update the September 2012 projection in a few days, but I’ll also be looking at the future course of the Arctic sea ice “death spiral“. (Unsurprising sneak preview: Virtually sea-ice free summers, defined as September extent below 1 million sq km, will likely arrive in the Arctic before 2030).
[UPDATE Sept. 3-6: The updated projections are:
- Sept. 3: 3.56 +/- 0.12 million sq km
- Sept. 6: 3.57 +/- 0.12 million sq km ]
[UPDATE Sept. 13: Sea ice extent has flattened out considerably in the last week or so; nevertheless the 5-day average is still descending, if ever so slightly. The net effect is that the short-term projections for the September average are edging upwards.
Now that we’re in September, I’m tracking two short-term models, one based on the latest 5-day average (as before), and the other on September average to date (obviously, both models gave the same result on September 6). I tend to favour the latter, as it is more stable, and looks to perform a little better since 2007. Currently the “5-day” model projects a September average of 3.67 +/- 0.11 million sq km, and the “Sept to date” projects 3.63 +/- 0.11 million sq km. ]
[UPDATE Sept. 18-19: The latest available five-day extent, centred on September 16, is at 3.43 million sq km and rose for the first time in each of the last two days. Thus the minimum may well have been reached on the 5-day average centered on September 14, when extent was 3.41 million sq km. As of September 17, the “5-day” model projects a September average of 3.56 +/- 0.09 million sq km, and the preferred “Sept to date” model projects 3.61 +/- 0.09 million sq km.]

And rest assured that the horrific irony of Conservative prime minister Stephen Harper’s recent tour of the Canadian North to tout growing resource extraction opportunities will get a closer look. Harper appears to have failed to mention climate change and its devastating implications for the North – despite ending his tour on the very day the new daily sea ice extent minimum record was set.

Earlier in the year I thought this year’s minimum might be as low as, or lower than, 2007’s but it would be close. It’s turning out much worse than that and it looks like 2012 is a step change, just as 2007 was.
I look forward to reading the follow-up and where you think we’re heading over the next 10-20 years.
The angle of that nosedive doesn’t look like it wants to slow down yet.
The same can be said for NSIDC. http://t.co/0noGUea4
I’m not so sure of that. The last three days at NSIDC show 61K sq km melt (20K a day). The five days immediately before that had a record late August melt of 436K (84K a day). You can already see flattening in the updated chart above.
Nice to see you join the social game of watching paint dry / grass grow. Guess you have difficulty finding things to do to make the time pass. Though, from the rubbing-it-in department it beats replicating the trivial replication by Richard Muller and friends of what everybody already knew. Wake me up when you get hold of Muller’s email correspondence with the Koch Foundation 😉
In both cases, I’m laying a foundation.
All will become clearer soon …
The additional ice shrinkage this year may have pushed global albedo loss beyond the limits of what might be recovered by painting all the world’s roofs white.
It’s certainly slowed over the last four days. But I think it’s still too early to write off the possibility of further melting, though I hope ot is nearly at the minimum. I wonder how much heat is still left in the water for bottom melt. As it is extent, winds might also push the numbers either way. As I see it, it is already a catastrophe and we are waiting for the size of that catastrophe and who is going to get the polar air this winter: Europe, North America or Asia?
The refreeze will be fascinating too. Will it be delayed, setting up very weak ice to face next year’s El Nino? If that happens, the proverbial could really hit the rapidly rotating air circulating device.
The NSIDC nrt extent index has not stopped falling yet: -104k on 8/31, now down to 3.69m.
And another 81K gone. Unless I’m reading the NSIDC data incorrectly, it seems pretty likely we’re going to crash through 3.56 million sq km pretty soon.
Pingback: Another Week of GW News, September 2, 2012 – A Few Things Ill Considered
Yesterday was down 22K. The five-day melt stands at 214K, with recent one day values ranging from +103K to -40K. As noted previously, the five-day melt from Aug 23-27 was 436K.
I’ve updated my projection for the September average extent (see above) – it is barely unchanged from a week ago. It now stands at 3.55 million +/- 0.12 sq km.
Note that an average sea ice extent of 3.4-3.7 million sq km in September implies a *daily* minimum in the range of 3.2-3.6 million sq km, with the official NSIDC five-day minimum slightly higher.
September 5 was down a huge 100K from previous day, to 3.63 million. Looks like your model may undershoot (like so many others).
I’m doing some graphing and analysis, and the interesting thing for me is that we’re now down 32% vs 2003-2011 average daily numbers as of September 6, 2012.
Sea ice extent gained 90K sq km yesterday, so the daily minimum (3.49M sq km on Sept 6) and the 5-day minimum (currently 3.54M sq km) may have been reached.
Here is the latest chart (also updated above).
I still expect September monthly average to be about 3.6 million sq km, 700K below previous record in 2007.
IJIS/JAXA:
Sept 6: 3676406
Sept 7: 3664531 (-12K)
Sept 8: 3595781
However the 7th’s prelim figure was bumped upwards by ~50K so I’d take yesterday’s preliminary -70K figure with a lump of salt.
But I think it will be negative even after the upwards adjustment I expect to see.
Definitely slowing, if not turning …
That’s one advantage of NSIDC – it doesn’t change.
I don’t know why IJIS/JAXA persists in publishing preliminary daily numbers.
On the other hand, a disadvantage is that they do five-day running averages on their graph for a reason (daily uncertainty in measurements is pretty high), while IJIS/JAXA feel justified in averaging over two days (different sensor and accuracy) and the choice is apparently widely accepted in the sea ice community.
Meaning I place less faith in the daily NSIDC figure (and in fact you see it rarely quoted), more on the IJIS/JAXA daily figure (once adjusted). But the shape of the smoothed IJIS/JAXA and NSIDC fit very closely, if the daily IJIS/JAXA figures continue to drift down I’d be amazed if the 5-day averaged NSIDC graph doesn’t do the same …
OK, the adjusted IJIS/JAXA figure showed a slight uptick in extent after all. 3.6 is acting like an impermeable barrier thus far. Today’s prelim is below again but since we’ve had at least three days of major upward changes in the prelim figure will probably do so again.
The end? We’ll see what the next few days brings!
Could the Arctic be ice free this month?
No, of course not. But why do I get the feeling this is a prelude to some out-of-context contrarian propaganda?
Oh no, my question had nothing to do with propaganda.
It’s just the trend is for more days of melting even past the normal time for ice melt and cyclonic activity is advertised to build up in the arctic.
Sorry about that misunderstanding.
The trend looks pretty flat to me, but one can’t rule out a “kink”, or an extended minimum like 2007. Still I can’t see anything close to an “ice free” scenario. But I’m no expert.
It wouldn’t surprise me to see the melt season last for about as long as it did in 2007. It’s slowing nicely and there’s no evidence ice extent is going to start reducing drastically as it was a week ago.
That will still leave us with an ice extend of 3.5-ish km^2, far far from zero.
[UPDATE Sept. 13: Sea ice extent has flattened out considerably in the last week or so; nevertheless the 5-day average is still descending, if ever so slightly. The net effect is that the short-term projections for the September average are edging upwards.
Now that we’re in September, I’m tracking two short-term models, one based on the latest 5-day average (as before), and the other on September average to date (obviously, both models gave the same result on September 6). I tend to favour the latter, as it is more stable, and looks to perform a little better since 2007. Currently the “5-day” model projects a September average of 3.67 +/- 0.11 million sq km, and the “Sept to date” model projects 3.63 +/- 0.11 million sq km. ]
[UPDATE Sept. 18-19: The latest available five-day extent, centred on September 16, is at 3.43 million sq km and rose for the first time in each of the last two days. Thus the minimum may well have been reached on the 5-day average centered on September 14, when extent was 3.41 million sq km. As of September 17, the “5-day” model projects a September average of 3.56 +/- 0.09 million sq km, and the preferred “Sept to date” model projects 3.61 +/- 0.09 million sq km.]
Updated charts (also seen in the post above):
NSIDC announcement of minimum should come any day now (today? tomorrow?).
http://nsidc.org/arcticseaicenews/2012/09/arctic-sea-ice-extent-near-minimum/
The NSIDC announcement came today …
http://nsidc.org/arcticseaicenews/2012/09/arctic-sea-ice-extent-settles-at-record-seasonal-minimum/
IJIS also appeared to hit its minimum on Sept 16, at 3.49 million km^2.
Record recovery commences! Watts will be trumpeting it soon, I’m sure! 🙂