The two most commonly cited estimates of temperature in the troposphere based on satellite data are provided on an ongoing basis by Remote Sensing Systems (RSS) and University of Alabama at Huntsville (UAH). Last year, a strong annual cycle was identified in the UAH data by Atmoz and was examined in detail by Tamino at Open Mind here and here. In UAH, the annual cycle results in significantly higher anomalies at the beginning of the year (northern hemisphere winter) than in the middle of the year. And this pattern appears to be present in all latitude zones.
It seems reasonable that such a cycle would affect the observed trends over the 30-year period of the satellite temperature record. And indeed, it turns out there is a strong seasonal divergence; UAH trends for June-July-August (NH summer or JJA) are markedly lower than for December-January-February (NH winter or DJF). This strong seasonal divergence can be seen not only globally, but even in the tropics, as shown in detail below. This suggests that UAH trends lack physical realism, and should not be relied upon until the source of annual cycle problem is identified and fixed.
First, though, here’s a bit of background. The UAH and RSS temperature data sets are based on analysis of exactly the same set of satellite observations of brightness in channels covering wide swathes of the atmosphere. The T2 channel (covering the troposphere and lower stratosphere) is used to derive estimates of the lower troposphere temperature, TLT (RSS) and LT (UAH). The analysis is complicated and includes corrections for orbital decay (resulting in diurnal drift) and “hot target” sensor adjustment, as well as adjustments to remove spurious stratospheric cooling. Any differences between UAH and RSS are entirely due to these differing adjustments.
Up until 2005, divergence between the surface trends and UAH (the only data set available until about 2004) was held up by skeptics as a major argument against the existence of global warming (let alone human attribution). In 2005, major errors were identified in the UAH analysis, and since then RSS and UAH have converged to some extent, although discrepancies remain . Nevertheless, as recently as 2007 both the Friends of Science and the Fraser Institute still mistakenly claimed that the UAH LT temperature trend was “almost imperceptible” (Friends of Science) or “nearly zero” (Fraser Institute). To this day, “skeptics” tend to cite UAH, which shows temperature trends that are consistently lower than RSS and the commonly cited surface sets (NASA-GISS, NOAA-NCDC and HadCrut).
My interest in the annual cycle as a possible explanation of remaining discrepancies between UAH and RSS was piqued by Tamino’s first post on the subject. I thought it would be interesting to look at seasonal trends, and at the time (back on October 22!) I noted my initial efforts:
I’ve confirmed large differences between winter and summer month linear trends (over the full 1979-2008 period) in UAH TLT and TMT global monthly anaomaly data. These differences can even be seen in the UAH TLT tropical data.
In his follow up post on October 30, Tamino confirmed the annual cycle in the tropical zone, and even in the southern hemisphere.
Now on to the trend analysis. We use the abbreviations “DJF” and “JJA” to refer to the two “seasons” (December through February and June through August respectively). In the seasonal graphs, therefore, the years are meteorolgical, starting in December (and ending in November). The seasonal averages are unweighted and the RSS December, 1978 values have been interpolated (based on applying the average difference with UAH from the following two months).
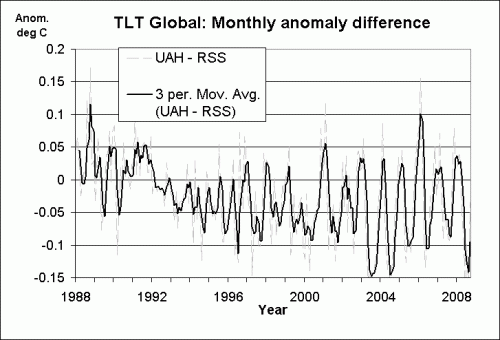
First we’ll look at the difference between UAH and RSS monthly anomalies in the global lower troposphere temperature record. The UAH annual cycle, which is plainly evident since at least 2000, results in a markedly lower temperature anomaly in mid-year (northern hemisphere summer) when compared to RSS.
The swing in temperature anomaly difference reaches almost 0.2 deg. C in recent years, even when three month averaging is used. As noted above, this difference is annual cycle is a result of the cycle within the UAH data set, which in turn is reflected in a seasonal divergence at the global level.
The seasonal trends for RSS (and UAH for DJF) are close to identical at .16 deg C per decade. But the UAH JJA trend is much lower – only .10 deg C per decade. Now, there is some theoretical basis for enhanced trend in NH winter, even globally, since warming is stronger over land and during the winter season. But over the short thirty year period, the effect should be very slight or even negated by random variations. We can check this with the surface record, using the NCDC (NOAA) data set with anomalies adjusted to the same 1979-1998 baseline period.
Like RSS, the NCDC trends show almost no difference; in fact, the JJA trend is slightly greater (the result of a large difference at the 2008 end point).
We turn now to examining the tropical zone. Of course, this is a particularly controversial data set, since skeptics claim that the lack of a “hotspot” in the UAH LT tropical troposphere data set invalidates climate model projections.
As before we see a big difference between UAH and RSS over the annual cycle.
The annual cycle is even more pronounced and appears to go back to at least 2000. Unlike the global case, UAH is lower than RSS in each and every month from 1996 to 2008; during NH summer that difference reaches as much as 0.3 degrees!
One wouldn’t expect much seasonal divergence in the tropical trends, as annual cycle temperature variations are much smaller and hemispheric seasonal differences between northern and southern tropics should cancel out in any case. On the other hand, the confidence interval for these annually resolved seasonal zonal temperature series is very wide indeed (with an unadjusted standard error of .20-.25 for the series discussed below), and this uncertainty could well result in some apparent divergence. Moreover, the periods are short enough that some small random divergence could very well exist over the period in question.
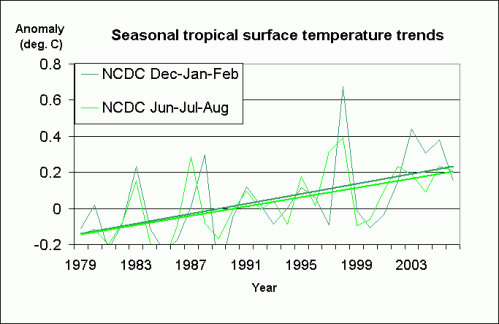
The NCDC data set does show a small divergence through 2006 (the last year for which zonal data is published).
RSS also shows a slight divergence, but, as in the global case, the UAH tropical seasonal divergence is very large.
RSS seasonal trends are close: 0.17 deg. per decade (DJF) and 0.15 deg. per decade (JJA). The UAH NH winter trend is somewhat lower at .12 deg. per decade, but the UAH NH summer trend is a fraction of that – only .04 deg. per decade.
This wide divergence in the UAH trends seems implausible, and casts serious doubts on the overall UAH tropical trend (currently pegged at 0.06 deg. per decade).
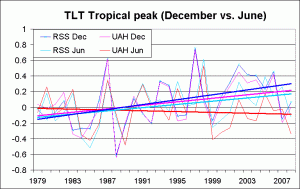
By inspection, peak divergence in the tropics appears to occur between the months of December and June. Here is the NCDC plot through 2006:
There is noticeable divergence (.15 deg. per decade for December vs .12 for June).
In the satellite records, RSS shows a little more divergence for the same “peak” months, but the UAH divergence is very striking:
In UAH, the December trend is 0.11 deg C per decade, while the June trend is downward, at -0.03 deg C. Taking these trends at face value, one would have to conclude that there are both warming and cooling trends in the tropical troposphere, depending on the month of the year!
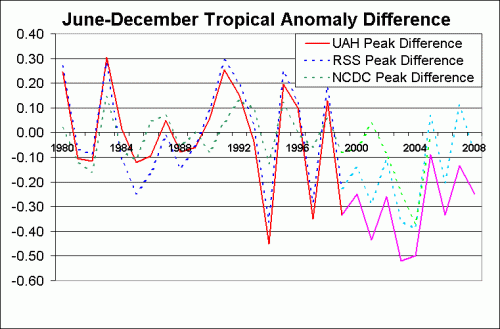
The following graph takes a look at the swings between the “peak” months. These were calculated by taking the difference between each June anomaly and the average of the preceding and following December anomaly. For the 1980-1999 period this anomaly difference fluctuates quite widely, but is almost exactly zero on average, for all three data sets.
From 2000 on, June is cooler on average in all three data sets. But the UAH June-December difference is clearly more pronounced; it is more than -0.3 degrees on average and is less than zero in each and every year.
All three data sets show some evidence of relatively warmer DDJ seasons in recent years. But even if this presumably temporary phenomenon is real, the UAH annual cycle is so extreme in those years that there can be little doubt that some sytematic bias has been introduced into the analysis.
In a comment addressing the annual cycle, Robert Randall noted: “The diurnal and hot target corrections … have an annual cycle in them.” He also suggested zonal and land-ocean comparisons might be useful. In line with that suggestion, I am planning a subsequent post comparing satellite trends for land and ocean within various zones, especially tropical and southern latitudes, where the discrepancies appear to be greatest.
Interestingly, Randall also stated that the magnitude of the annual cycle would be greater over land than ocean “due to diurnal cycle”. But in his follow up post, Tamino found just the opposite in UAH data set – the cycle was more strongly present over ocean.
However in the end, identification of the source of the annual cycle will probably involve more detailed data analysis, perhaps by comparing gridded daily data (instead of monthly zonal) or else going over the UAH and RSS calculations in complete detail.
It appears that at least one member of the UAH team, John Christy, is aware of the annual cycle, as he responded via an intermediary to another point in Tamino’s original post. I do hope the various satellite analysis teams are working on this, and that one of them will be able to resolve the problem. In the mean time little faith should be placed in the UAH data set.
Other links/further reading: IPCC AR4 (section 3.4.1), RSS, UAH data.
Mears, Carl A.; Wentz, Frank J. (2005). “The Effect of Diurnal Correction on Satellite-Derived Lower Tropospheric Temperature”. Science 309 (5740): 1548–1551. [RSS team]
Christy, J. R.; Norris, W. B.; Spencer, R. W.; Hnilo, J. J. (2007). “Tropospheric temperature change since 1979 from tropical radiosonde and satellite measurements”. Journal of Geophysical Research 112: D06102. [UAH team]
Randall and Herman (2008). “Using limited time period trends as a means to determine attribution of discrepancies in microwave sounding unit-derived tropospheric temperature time series.” Journal of Geophysical Research 113: D05105.


To the eye, the major differences appear to start ~1999, concurrent with the launch of the AMSU. The difference could be how the AMSU and MSU data were merged. The last MSU failed ~2004.
Also FWIW things like your graph of the big difference between UAH and RSS over the annual cycles look like two sinusoidal oscillations moving in and out of resonance.
[Response: Eli, thanks for coming by (and being the first to comment). It does seem that the major divergence starts after the launch of NOAA-15 (in May, 1998 I think). But there may be more to it than that.
One problem with UAH LT is that the data changes quite a lot within the same version (which has been 5.2 since 2005). This is possibly related at least in part to the inclusion of the AMSU on the AQUA satellite since early 2008, with data merged with NOAA-15 back to 2002 (see the UAH readme file). Now it turns out that NOAA-15 is no longer even being used at all, according to Roy Spencer’s website:
I guess they they forgot to update the LT 5.2 Readme. But it turns out that the differences in raw data since 2002 are much more substantial than I thought, since RSS does not use AQUA at all, apparently. I haven’t seen this discussed very much … I feel another post coming on.]
Hi–
UAH – June vs Dec definitely looks like a mismatch which is troubling. But, it would be useful to add uncertainty intervals just so we can see. (By eyeball, I expect them not to match. But it’s still worth checking.)
[The CIs are quite wide – the unadjusted standard error is on the order of 0.2 deg. C per decade. But that’s not the whole story.
These diverging trends are a symptom of an annual cycle in UAH which has a remarkably coherent effect, peaking early in the year, descending smoothly to a trough around May/June and back up through remaining months.
Widely diverging trends with random spikiness would be troubling enough (even if technically they were within the uncertainty bounds). But the smooth annual progression, as evidenced in the strong peak in the 12-month cycle in the Fourier power spectrum for recent years’ data, and in the resulting pattern of monthly trends I have noted, makes it clear that something is seriously amiss here.]
Pingback: UAH annual cycle continues in 2009 « Deep Climate
Speaking as a very old and old fashioned Physical Chemist I am astonished that anybody can expect to obtain any meaningful measurements of “mean global temperatures”, especially when they are apparently being measured to a tolerance of, say, +/- 0.o1C, in a totally chaotic climate syystem where the actual surface temperatures at any time can vary from, say, -45C to +45C. Any data obtained must be so suspect as to be totally meaningless.
I want the time series of annual values of global tropospheric ttemperatures from 1900 up to date. Can you send?
Regards.
R. P. Kane
[DC: Since estimates of global tropospheric temperature are based on analysis of satellite-based sensor records, these values are only available from 1979 on.]