
 Previous posts have examined scholarship issues in the Wegman Report and Wegman et al’s core flawed statistical analysis of the “hockey stick” graph. Now I show that a recent WIREs Computational Statistics overview article on colour theory and design by Edward Wegman and protege Yasmin Said is based mainly on unattributed “flow through” decade-old material from various websites. These have been augmented by further unattributed figures and text from current online sources, including five Wikipedia articles (see figure above right).
The first anniversary of “hockey stick” co-author Ray Bradley’s complaint against George Mason University statistics professor Edward Wegman has come and gone, but the ensuing proceeding at GMU shows no sign of resolution. Similarly absent is any indication of the release of code and data, promised by Wegman back in 2006, nor an explanation for the obvious problems permeating the Wegman Report’s core statistical analysis.
But through it all there has been one obvious question: if the Wegman Report and the follow up federally funded Said et al on co-author social networks showed clear evidence of cut-and-paste scholarship, what might a close examination of other recent (or even not so recent) scholarship from the Wegman group reveal? To be sure, there already hints at the answer seen in problems in PhD dissertations from Said and others at GMU, and the insertion of a couple of paragraphs from the PhD dissertation of computer scientist David Grossman into a Wegman et al’s 1996 technical report.
A recent article by Wegman and Said in WIREs Computational Statistics opens up a whole new avenue of inquiry – and reveals a remarkable pattern of “flow through” cut-and-paste that goes even beyond Said et al 2008. Colour Design and Theory (published online in February) is based largely on a 2002 course lecture by Wegman. However, this is no case of simple recycling of material, for most of the earlier lecture material came from obscure websites on colour theory and was simply copied verbatim without attribution. Now much of it has shown up, virtually unchanged, nine years later. And the old material has been augmented with figures and text from several more decidedly non-scholarly sources, including – wait for it – five different Wikipedia articles.
This tangled web is probably best approached with a flow diagram showing the relationship of the two works in question, along with the main unattributed antecedents (taken from the introduction to my detailed analysis of Wegman and Said 2011).
As seen in the above figure, the unattributed antecedents of Wegman and Said 2011 fall into two distinct groups:
1. More than 90% pages of content in Wegman 2002 contain content identical to six online sources available at that time, including a Kodak tutorial on digital colour and a web page on color theory by Ted Park. In turn, much of this material found its way into Wegman and Said 2011, again unattributed for the most part.
2. Additional unattributed material in Wegman and Said 2011, both text and figures, can be traced to five different Wikipedia articles, as well as other non-academic online sources, such as All Experts and Wiki Graphics.
Colourful Lecture
When I first examined the opening pages of Wegman and Said’s Color Design and Theory, I quickly found a few paragraphs that could also be found in obscure web pages. Yet the relationship seemed fragmentary, while other passages that bore all the hallmarks of the Wegman group’s style of cut-and-paste scholarship proved even more intractable to my normally effective detection techniques.
A key breakthrough came when I realized that the article was largely based on a set of Wegman’s course lecture notes on the same subject. (If I had read all the way through to the acknowledgments, I might have gotten there sooner, but so it goes). My detour through the original version of the lecture led me to its antecedents, some of which are no longer available on the Web. Only after completely mapping that lecture’s antecedents did I return to the 2011 article, which then became much more amenable.
So I’ll begin at the beginning – Wegman’s 2002 course entitled Scientific and Statistical Visualization. The course introduction shows the course to be structured in two parts, with part 1 covering geometric aspects such as rotations and transformations. Lecture 4, however, gave mainly non-mathematical backgound material on colour theory and design.
It is perhaps to be expected that a professor giving background material in an area well beyond his specific expertise would draw on others’ material. In this case, the final page lists six so-called “resources”, which might imply that these were given for further supplementary information. Nevertheless, it seemed reasonable to examine these further.
As regular readers have no doubt already surmised, it turns out that Wegman borrowed very liberally indeed from these “resources” to create his lecture. In fact, at least 76 out of 83 lecture slides appear to be cut-and-paste excerpts from the antecedents (either text or figures), with not a single specific acknowledgment or attribution. However, an occasional sentence or phrase has been interpolated from time to time.
The first few slides rotate between three of the main sources for this lecture, two of which are no longer active, but are available via Archive.org’s snappy new Wayback Machine. (By the way, the new version is still in beta, but performs way better than the “classic” one). Here they are:
- Ted Park’s Color Theory Page
- Kodak Digital Color online tutorial
- Marc Green Color Theory & Design SBFAQ
Now let’s see how the opening of the lecture shifts between them at a rapid rate. In each case, I’ll show the lecture text or figure and a link to the appropriate section of its antecedent. (As usual, identical text highlighted in cyan).
The lecture opener on page 2 is from Ted Park’s 1999 Color Theory Page (A2):
Human vision relies on light sensitive cells in the retina of the eye. There are two basic kinds of sensors. These are rods and cones. Rods are cells which can work at very low intensity , but cannot resolve sharp images or color. Cones are cells that can resolve sharp images and color, but require much higher light levels to work. There are about 107 foveal cones. Cones are cells that can resolve sharp images and color, but require much higher light levels to work.
Page 3 shows a diagram, not of the human eye as one might expect, but rather showing the three “essential elements”, from the Kodak Digital Color course:

Then it’s back to Ted Park again, again with a slight interpolation:
There are three types of cone. A somewhat simple interpretation is that
red cones are sensitive to red light, green cones are sensitive to green light, and blue cones are sensitive to blue light. The perception of color depends on an imbalance in the stimulation level of the different cell types.
As we shall see later, this is still not quite correct, but it would take another nine years until the point was further clarified.
Page 5 has no identified antecedent, but is even more simplistic in its discussion of colour perception of a red tomato (never mind that two slides earlier we were looking at a red apple):
The tomato absorbs the light from 380 nm to 580 nm and reflects the light from 580 nm to 780 nm. This light reaches our eyes, where it excites the cones that have their sensitivity centered on 570 nm. The signals from these cones are finally processed by our brain. This particular sensation called “red”, we are taught.
In a way, this is even worse than the previous slide, as it fails to make clear that color perception depends on the combined response of all three types of cones. But no matter, it’s time to shift again, this time to the third source, Dr. Marc Green’s colour SBFAQ (“Should Be Frequently Asked Questions”).
The relationship between wavelength and actually hue is roughly:
620–730 nm: red
590–610 nm: orange
550–580 nm: yellow
490–540 nm: green
450–480 nm: blue
380–440 nm: violet.
Here the omission of “nm” in the first line has been corrected, yet the glaring error “actually hue” (instead of “actual hue” ) remains. Again, it would take nine years for that error to be rectified.
After jumping back to the Kodak presentation for a slide on illumination, light intensity and color perception, the lecture settles into a sequence of topics:
- Additive and subtractive color (slides 8-13 from Ted Park)
- Color systems based on hue and saturation (slides 15-26 from Kodak)
- Colour blindness, oddly enough (slides 31-48 from Marc Green part 4)
- Colour design (slides 49-64, again all from Marc Green, except for two slides)
- Graphic design (slides 66-84, all from Alexander Mundi’s interactive Flash presentation).
I’ll skip the colourful details, but for those interested there is a complete “map” of Wegman’s lecture in section 2 of the detailed analysis [PDF].
The evolution of a lecture
There are (at least) four subsequent versions of Wegman’s colour theory lecture. The first of these was given as part of short course on Statistical Data Mining given at the 2002 Army Conference on Applied Statistics.That version is essentially identical, save for the addition of Jeffrey Solka of the Naval Surface Warfare Center as co-author. Solka, who got his PhD under Wegman in 1995, presumably provided other course lectures. Presumably, too, the ACAS course may well have been supported by general or specific conference funding by the supporting organizations, raising issues beyond cut-and-paste scholarship.
Subsequent versions, in 2005, 2008 and 2010, were part of Wegman’s Statistical Data Mining course. The content, mistakes and all, did not change very much, although 2005 did see the addition of two slides with a mathematical treatment of saturation, from the Wikia graphics page on saturation:

Bizarrely, this was captured as an image, dragging along the underlined former hyperlinks along with the equations.
The lecture was also much shortened by the deletion of the Mundi graphic design material in 2010. But perhaps the most intersting change over the years was on the last page, the list of “resources”. The 2010 version simply lists:
Color Theory
http://en.wikipedia.org/wiki/Color_theory
Graphic Design
http://en.wikipedia.org/wiki/Graphic_design
Thus, by 2010 all traces to the actual sources used had been excised.
Wegman and Said get their own journal
Meanwhile, in 2009 the scientfic publishers John Wiley and Sons set up a group of review journals dubbed Wiley Interdisciplinary Reviews, more commonly known under the snappy acronym WIREs. Each of the journals in the growing WIREs stable follows a common “model” focusing on interfaces between traditional disciplines. WIREs Computational Statistics was established under the joint editorship of the Wegman Report trio of authors: Wegman, Said and David Scott of Rice University. Its mandate:
The goals of WIREs Computational Statistics are to (1) present the current state of the art of Computational Statistics through an ongoing series of commissioned reviews written by leading researchers; (2) capture the crucial interdisciplinary flavor of this field by including articles that address key topics from the differing perspectives of statistics and computing, with applications in areas such as technology, biology, physics, geography, and sociology; (3) follow the rapid development of Computational Statistics through a systematic program of content updates; and (4) encourage new participation in this field by presenting its achievements and challenges in an accessible way to a broad audience.
A closer look at WIREs Comp Stat raises a host of issues that I will discuss another time (although interested readers can get a head start by looking at the journal’s guide for authors). For now, I’ll merely note that potential problems with Wegman and Said’s submission to WIREs go well beyond even those in Said et al 2008 in Computational Statistics and Data Analysis, where a dubious paper from a member of the journal’s advisory board (Wegman) and one of its associate editors (Said) sailed through peer review in a mere six days.
Turning at long last to Color Theory and Design, I’ll begin at the end – with the acknowlegment:
This article is based on lectures given by one of us (E.J.W.) in graduate courses in Statistical Data Mining and in Scientific and Statistical Visualization. Much of the discussion in the Section on Color Deficiencies in Human Vision and the Subsection on Hard-Wired Perception is based on material in Green (2004). The inspiration of Marc Green is hereby gratefully acknowledged.
Of course, now that we know that the lecture was itself mainly taken verbatim from other online sources, a careful side-by-side comparison with the lecture and its “flow through” antecedents is clearly in order. The detailed comparison can be found in section 4 (starting at page 5). The action starts early – at paragraph 2 (as usual, cyan highlighted text is identical to antecedents, and yellow represents trivial changes):
Human vision relies on light sensitive cells in the retina of the eye. There are two basic kinds of sensors. These are rods and cones. Rods are cells which can work at very low light intensity (scotopic) , but cannot resolve sharp images or color. The rods contain a pigment, rhodopsin also called visual purple, which saturates at higher levels of light. Cones are cells that can resolve sharp images and color, but require much higher light levels to work.
The opening is recognizably the same as that of the lecture, which came from Ted Park’s Color Theory page at beer.org, as seen above. But the worthy text has also been butressed, and as we shall see in a moment, the 20th century web images and diagrams also had to be discarded and new ones found. And what is this new source used to update the decade-old lecture? The answer starts with “W”.
Wegman (p. 2) – Color Theory Page (Ted Park)
Human vision relies on light sensitive cells in the retina of the eye. There are two basic kinds of sensors. These are rods and cones. Rods are cells which can work at very low intensity , but cannot resolve sharp images or color.
Wikipedia – Eye
Rods cannot distinguish colours, but are responsible for low-light (scotopic) monochrome (black-and-white) vision; they work well in dim light as they contain a pigment, rhodopsin (visual purple), which is sensitive at low light intensity, but saturates at higher (photopic) intensities.
Wegman (p. 2) – Color Theory Page (Ted Park)
Cones are cells that can resolve sharp images and color, but require much higher light levels to work.
That’s right! In just this one half-paragraph, a sentence from the Wikipedia article Eye has been whittled down and placed within the the previous Ted Park material. And then, for good measure, the word “scotopic” has been moved into the previous sentence, and in the style of verbose paraphrase we have seen before, “higher intensities” are now “higher levels of light”.
Fortunately, this level of extreme “scholarly” editing could not be sustained, and the end of the paragraph is simply a “flow through” from Park.
In fact, the whole of the opening of the lecture above has been incorporated into the first section Human Vision, including all the copied material from Kodak, Ted Park, and yes, even the Marc Green FAQ. As seen in the side-by-side comparison (pages 5-7), most changes are extremely minor, as in the belated correction of “actually hue” to “actual hue” in the Marc Green enumeration of wavelengths.
The only substantive addition in this section is a clarification of of Ted Park’s explanation of cone sensitivity. The original reads:
Red cones are sensitive to red light, green cones are sensitive to green light, and blue cones are sensitive to blue light. The perception of color depends on an imbalance among the stimulation levels of the different cell types.
While Wegman and Said have incorporated this word-for-word, let’s give credit where credit is due; they actually manage to improve this somewhat with an interpolated addition.
A simplistic interpretation is that red cones are sensitive to red light, green cones are sensitive to green light, and blue cones are sensitive to blue light. More precisely, the cones are sensitive to long, medium, and short wavelengths of light. The peak response of the cones do not actually occur precisely in the red, green, and blue color bands, but the perception of color depends on contrast among the stimulation levels of the different cell types.
Mind you, this is still not quite right, as the actual peak sensitivities of so-called “red” and “green” cones are actually quite close to each other; both could be characterized as medium-long, but are far enough part to distinguish red and green easily. And “contrast” is less precise than Park’s “imbalance”.
An interesting new twist, though, is the incorporation of some snazzy images. Like this schematic diagram of the eye (Wegman and Said at left … and Wikipedia at right).
 FIGURE 1 | Schematic diagram of the human eye. This image is used under the Creative Commons Attribution-Share Alike 3.0 License. Details are FIGURE 1 | Schematic diagram of the human eye. This image is used under the Creative Commons Attribution-Share Alike 3.0 License. Details areat http://creativecommons.org/licenses/by-sa/3.0/legalcode. |
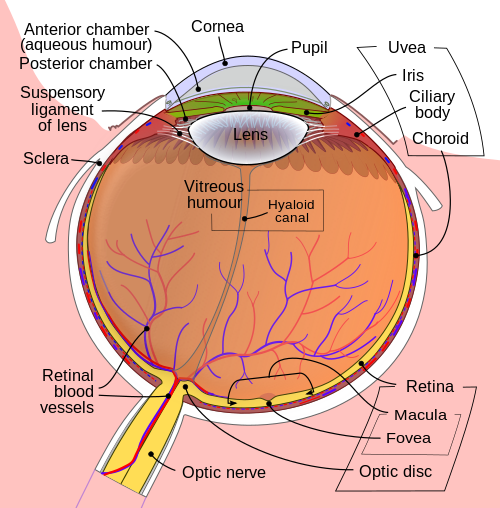 Schematic diagram of the vertebrate eye. Schematic diagram of the vertebrate eye. |
Notice that Wegman and Said cite the applicable Creative Commons “Attribution-Share Alike” license, but fail to actually attribute the diagram as required. And they have even changed the text of the caption from the original to one that fits better with their article (even if it’s not accurate).
Colour theory in a sea of cyan
A similar pattern obtains in the next section on color theory, which at a full six pages is the longest section of the overview article. Large swathes of very lightly edited passages from the original lecture’s main sources, Kodak and Ted Park, are interspersed with new, more heavily edited excerpts from Wikipedia and the occasional connecting original material.
As an example, consider this long swathe from Park via the Wegman lecture, which has recieved only trivial changes:
Additive color processes, such as television, work by having the capability to generate an image composed of red, green, and blue light. Since Because the intensity information for each of the three colors is preserved, the image color is preserved as well. The spectral distribution of the image will probably be wrong, but if the degree of intensity for each of the primary colors is correct, the image will appear to be the right color. Red, green, and blue are the additive primary colors because they correspond to the red, green, and blue cones in the eye.
Subtractive color processes work by blocking out parts of the spectrum. The idea of subtractive color is to reduce the amount of undesired color reaching the eye. If, for example, you one had a yellow image, you one would want to have a dye that would let red and green reach the eye, and block out blue. The additive secondaries become the subtractive primaries, because each of the additive secondaries will reflect two of the additive primaries, and absorb one of the additive primaries.
Diagrams and tables from Park have been reproduced as well; for example, the additive secondaries figures has been reproduced, albeit with slightly darker colors and more discreet symbols:


In contrast, Wikipedia’s article on the 1931 CIE Color Space has not only been cut-and-pasted, but sliced and diced as well, as seen in the following excerpt from page9 of the side-by-side analysis (click on the image capture to see a larger, readable version).
 This may well be the most breathtaking example yet of the extreme editing sometimes seen in the Wegman group’s peculiar brand of scholarship, as phrases have been moved around with great abandon.
There is also a particularly notable example of the “expansive paraphrase” technique. The Wikipedia original discusses the “standard (colorometric) observer”, but then simplifies subsequent references to the “standard observer” or even plain “observer”. But Wegman and Said repeat “standard colormetric observer” five times in the space of six sentences. If the word count needs to be boosted, every little bit helps.
Here too we see yet another example of the type of errors that inevitably occur when the authors attempt to paraphrase or “improve” the original. The Wikipedia article states:
Due to the distribution of cones in the eye, the tristimulus values depend on the observer’s field of view. To eliminate this variable, the CIE defined the standard (colorimetric) observer. Originally this was taken to be the chromatic response of the average human viewing through a 2° angle , due to the belief that the color sensitive cones resided within a 2° arc of the fovea.
This has been rendered more verbosely (yet less precisely) by Wegman and Said (with the most obvious error underlined) :
Because of the distribution of cone cells on the retina, color perception depends on the field of view with each individual having different distribution and different field of view. The CIE sought to eliminate this variability be defining a standard colorimetric observer. With the belief that most cones are located within 2° of the fovea, the chromatic response of the standard colorimetric observer was taken to be the response of the average human within 2°.
In their first sentence, Wegman and Said state that the “field of view” is a varying attribute of the individual, whereas it clearly refers to the fact that color perception in general greatly depends on the observable angular extent. Because cones were thought to be almost wholly concentrated at the centre of the fovea (not “mostly”), the original “standard colorimetric observer” was based on experimental data from subjects viewing through a narrow 2° angle. This was later amended to 10° in later (but less used) versions of the CIE standard that are recommended for use in wide field applications. And the final sentence removes a couple of words, turning the clear reference “within a 2° arc of the fovea” into the ambiguous ” within 2° of the fovea”, implying that the fovea is the centre point, and the cones are “within 2°” of it.
Space (and blogger fatigue) prevent a full catalog of all the cut-and-paste scholarship in Wegman and Said 2011. And I’ve only touched on the first half of the article! But the analysis – all 20 pages of it – does cover all the unattributed (or inadequately attributed) antecedents in excruciating detail. For those less inclined to slog through it here is a summary of all 12 sources of unattributed material, and their use page by page in Color Theory and Design (click on the table image to get a PDF version).
 However, I will continue another time with a discussion of the second half of the article, which has severe problems of its own, even if there is less blatantly “strikingly similar” material. And I’ll also analyze some broader issues only touched on above, including questionable citations, lack of attribution of “commons” material, and peer review in the context of what appears to be perilously close to a vanity journal with decidedly uneven standards.
And this is not the only new example of highly questionable scholarship by Wegman and Said uncovered recently. In fact, the very latest discovery (to be presented in a week or two) is even more shocking, as it concerns subject matter supposedly at the core of the Wegman group’s expertise. Indeed, the time is fast approaching when George Mason University will no longer be able to ignore the obvious problems and sweep them under the rug.
==================================
Main references:
- Edward Wegman and Yasmin Said, “Color Theory and Design”, Wiley Interdisciplinary Reviews: Computational Statistics, Volume 3, Issue 2, pages 104–118, March/April 2011. Online Feb. 4, 2011.
- Edward Wegman, Scientific and Statistical Visualization (Course), Lecture 4. Online version Feb, 2002.
- Deep Climate, Dubious Scholarship in Full Colour: Antecedents of Wegman & Said (2011) and Wegman (2002), March, 2011 [PDF]

I’m starting to feel sorry for the guy! Almost.
This is pathological (on Wegman’s part). I don’t think he can stop. Perhaps a cry for help?
Just as Charles Ponzi is immortalized in our language by “Ponzi scheme”, might I suggest a “Wegman Index” for the ratio of an academic publication that is plagarized. A Wegman Index of 0 means it is all original work, whereas a Wegman Index (WI) of 1 means it’s a hundred percent ripoff. A second figure could be added for the percentage of the padding text that is that is actually wrong. One could then give the WI on a set of Cartesian coordinates. Thus a WI of (0.9, 0.04) would imply 90 percent directly ripped off and forty percent of the padding incorrect. The WI of this post is, of course, (0.99,0.01) but I’m too lazy to find out who I copied it from.
Would it be better to use integers and have 0 and 100 as the two extremes?
These long meandering posts really would do well with an abstract, so one has some idea of where it’s going and whether it’s of interest.
Though when Wegman et al are involved, I suppose one already knows where it’s headed.
Generally, I’ve now settled into a pretty formulaic approach, which I’d like to think is an improvement on my early efforts.
Para 1: Context
Para 2: Introduction
Para 3: Summary of contents
Read more==
But I can see that an abstract might be better for regular readers in a hurry, especially those who don’t care for my writing or attention to detail. So I’ve tried an abstract too (at the top in italics), together with a key diagram (in this case).
Nice, that serves the purpose well.
The wikipedia eye diagram is Public Domain, since its first revision (25 Jan 2007). So, if that is true, technically, W&S didn’t have to attribute the diagram to anyone, as they were mistaken about its copyright status.
Another possibility is that the eye diagram on wikipedia is itself not original. You’d have to get in touch with the person who uploaded it.
Whatever the issues with copyright, this is probably yet more plagiarism. You still have to cite your sources.
That’s the whole thing, isn’t it? Copyright issues cleared, great! But from whom did you take the picture? Proper attribution is important, and something that in particular Said seems to have quite a few problems with. And Wegman really doesn’t know how to check this kind of stuff. Which, in turn, makes you think what else he forgot to check…
This post prompted me to look at some other articles in WIREs:CS. The paper “Roadmap for optimization” (Volume 1, Issue 1, August 2009, DOI: 10.1002/wics.16) by Said and Wegman, for example. The section from that article on the Karush-Kuhn-Tucker regularity conditions has a striking resemblance to the section of the Wikipedia page describing those conditions. The main differences are that the WIREs article denotes the objective function by phi instead of f and one of the regularity conditions given in Wikipedia (QNCQ) is not included in the WIREs article.
One final, important difference: The Wikipedia article states that only one regularity condition needs to be satisfied to ensure the KKT conditions, whereas the wording in the WIREs article implies (but doesn’t quite say) that all the listed regularity conditions need to be met to ensure the KKT conditions hold. The WIREs article is at least less clear than its Wikipedia counterpart and perhaps outright wrong. Any linear programmers care to comment on that last point?
Wegman “Automated Generation of Metadata for Mining Image and Text Data” http://www.freepatentsonline.com/y2010/0223276.html
“Data mining is a process of nontrivial extraction of implicit, previously unknown and potentially useful information”
Wikipedia: http://en.wikipedia.org/wiki/Data_visualization#Data_mining
“It has been described as “the nontrivial extraction of implicit, previously unknown, and potentially useful information from data””
which refers to: W. Frawley and G. Piatetsky-Shapiro and C. Matheus (Fall 1992). “Knowledge Discovery in Databases: An Overview”. AI Magazine: pp. 213–228. http://www.kdnuggets.com/gpspubs/aimag-kdd-overview-1992.pdf “Knowledge discovery is the nontrivial extrac- tion of implicit, previously unknown, and potentially useful information from data.”
The joys of data mining…
While funny, this is difficult to call plagiarism, as it likely has become a generally accepted description of the field. There are only so many ways to describe what data mining is in a few words.
I would agree that it’s not a particularly compelling example, given its context, and all the other examples out there (and more to come).
But as I pointed out regarding Said et al (2008), even broad canonical descriptions and definitions (in that case, from Wasserman and Faust) *are* cited in the scholarly literature. Said et al were the only authors who failed to do so in that particular case.
Of course standards are much lower on the broader internet.
fair points – I just thought it was an amusing given the topic was data mining
That is more prescient than you know.
I imagine Wegman regrets ever taking on the task of backstopping M&M.
Like the end of Robert Frost’s “The Witch of Grafton”:
if I’d a-known when I was young
And full of it, that this would be the end,
It doesn’t seem as if I’d had the courage
To make so free and kick up in folks’ faces.
I might have, but it doesn’t seem as if.
Perhaps a few e-mails to Wiley (or whoever is the editor of this issue) are in order? And I’m sure the Kodak company will be interested to know who’s been ripping off their stuff.
— frank
Yes, it’s Wiley. Of course, since the authors are also editors-in-chief of WIREs Comp Stat, raising the issue with Wiley is a little more complicated than it would be otherwise.
But I’m fairly confident that will happen, if it hasn’t already.
There ought to be a prize, a T-shirt or something, for the first person to discover something that Wegman actually did on his own.
Meanwhile Deep certainly deserves a substantial award of some sort.
By all accounts Wegman is a very accomplished mathematical statistician. You don’t get to chair an NRC committee without some meaningful achievement and peer respect.
But clearly over the last decade or so something has gone wrong.
Maybe what went wrong is exactly his rise in peer acknowledgment? Busy, busy, busy, and at the same time a more relaxed peer review by some of his peers (“Oi, it’s Wegman, no need to check the references!”).
Wegman gets high praise at his University of Iowa alumni page, especially for his work at University of North Carolina.
http://www.iowalum.com/daa/wegman.html
What happened? Does GMU have some kind of Manchurian Candidate project going on?
1) I would guess that reviewers /editors rarely check for blatant plagiarism in articles from people they know or in fact, in general. It’s not likely to be a high payoff activity.
2) Quite a few of Wegman’s papers over last decade or so have gone to very friendly venues (or conferences), with the WIRES journal of coruse beign especially friendly.
OK, I’m impressed. Still, someone who attracts a long string of honors while repeatedly creating his own Centers where he can be Dr. Big is probably a good self-promoter in addition to his other talents, and as Deep says clearly something has gone wrong. When did it start? With Star Wars? Earlier? I suppose it would be hard to find out.
Since Kodak abandoned Kodachrome, their interest in defending their more colorful IP may have waned .
I am more curious as to Wegman’s role in vanity press journal start-ups and DIY peer review at Wiley
You distort, we deride
Awesome handle, I am jealous. But have decided not to go with a pseudonym for the remainder of this AGW ‘debate’ (i.e. until the arctic is ice free in summer, and Greenland and/or the permafrost melts, whichever comes first). Will probably regret it, but prefer to go down in the record as… myself: the gormless believer in what could have been.
Think about it. Mankind, or something akin to it, have only been around for about 6 million years. Took us just 250 – 300 years to wreck the place. So sad in the total scheme of things. Like lemmings with just-above-average IQs :-\
Pingback: Mmm » Ocasapiens - Blog - Repubblica.it
Probably for ideological reasons, Wegman trusted McIntyre. This will prove to be bad judgement on his part in the long run. Watch this space and others.
Picky picky. How about attacking the message instead of the messenger? I as well as many, many others question Mann’s hockey stick chart and many of the precepts of “global warming”–oops–it was changed to “climate change”. Why do you suppose?
Now I Are One,
The premise of your comment is mistaken.
Wegman et al’s lack of climate science knowledge amd bias against climate research led to the severe errors and distortions introduced in the editing of unattributed material, as exemplified in the tree ring background section.
And the “message” – i.e. Wegman’s core statistical analysis – is irredeemably flawed.
If you want to comment on the “message” please do so at the appropriate threads. Thanks!
I love these “it was changed to climate change” messages. Tell us, nowiareone, what does the CC in IPCC stand for, and when was this organisation created?
Want rebranding? Here you go…
That was Frank Luntz, political “adviser” to the Republican Party, actually rebranding “global warming” to “climate change” for the GOP to make global warming more politically and emotionally acceptable to the public. Read the actual report (PDF), it may give you a predictive template for Republican legislator soundbites and statements from now on. If that’s too much to read, here’s a more convenient template.
More:
* Happy 35th birthday, global warming!
* NASA – What’s in a Name? Global Warming vs. Climate Change
What Marco said. The IPCC was established way back in 1988. But further to that, the term ‘global warming’ was expunged from all formal guvmint communications and replaced with ‘climate change’ by the Bush administration in 2002, on advice from Frank Luntz, that the term ‘global warming’ sounded too ‘scary’. From the Frank Luntz Wikipedia entry:
That’s the main problem with you guys. You invariably never check original sources, always believing any old sh#t that denialist echo chambers like WUWT make up without bothering to critically analyse it for accuracy or consistency with what’s actually happening out here in the real world.
You should follow your own advice.
— frank
Sorry, looks like I was piling on there, but J Bowers comment was in moderation when I wrote mine, so didn’t see it.
In any case, NOWIAREONE’s comment was apparently a drive-by. Don’t think that person will be back to argue their lost cause.
“…and many of the precepts of “global warming”–oops–it was changed to “climate change”. Why do you suppose?”
It wasn’t. Global warming and climate change have both been used for many decades. In 1956 there was the paper, “The Carbon Dioxide Theory of Climatic Change ” by Gilbert Plass. As was pointed out above the “CC” in the IPCC stands for climate change, and the IPCC was formed in 1988. Climate change encompasses all of the changes that will occur with rising GHG’s, including ocean acidification, precipitation changes, and also rising sea levels. An increase in global temperatures is just one component of the overall change.
OK, my friends, play time’s over, let’s now return to the original topic of this thread… 🙂
— frank
Not only do I no longer have to answer the drive-bys and trolls by myself, but I don’t even have to remind people to get back on topic.
Wegman and Said will be for evermore be a watchword for professional suicide by Plagiarism / Xerography. Their academic futures would appear to be over, irrespective of the outcome of GMU’s ‘playing for time’ non-investigation which appears to be proceeding rather slower than the flow-rate of room-temperature granite. Their outside chances are zero, outside of a Koch Industries funded sinecure.
A secure future for both at GMU is therefore on the cards and GMU’s reputation lies in ruins.
Even a hummingbird couldn’t catch DC at work.
One thing people aren’t asking is why, in what I make out to be well after it became clear that interested parties were “on to him” did Wegman and Said go back to the Wikipedia well yet again? Could anything be more ignominious for a scholar? Or more destined to be exposed? Either I’ve got the timeline wrong, or that’s amounts to begging for a(nother) trip behind the woodshed.
Cry for help indeed.
Allow Eli to contribute a small meme
What did Oklahoma State University know and when did they know it?
Pingback: The Machinery of Climate Anti-Science « Greenfyre’s
Pingback: Wegman and Said 2011, part 2 | Deep Climate
Pingback: John Quiggin » Adventures in social network analysis: approaching the finale
Pingback: Wiley coverup: The great Wegman and Said “redo” to hide plagiarism and errors | Deep Climate