
In the “climategate” din, one accusation is shouted perhaps louder and more often than any other: the so-called “trick” supposedly played by IPCC lead author Michael Mann to “hide the decline” in Keith Briffa’s Northern Hemipshere extra tree-ring proxy-based reconstruction, featured along with three others in a key chart in the 2001 WG1 Third Assessment Report (TAR).
According to self-appointed climate science auditor Steve McIntyre, Mann took it on himself to truncate Briffa’s data set and replaced the deleted data with instrumental temperature data, thus creating less of a drop at the end of the resulting smoothed chart. But a closer examination shows the evidence for instrumental “padding” is far from certain. And the difference engendered between different possible “padding” values is minimal in any case.
Even worse, the key element of McIntyre’s narrative, namely the claim that Mann himself truncated Briffa’s data set, is false. In fact, it turns out that the actual data set used by Mann (as sent by Tim Osborn on Keith Briffa’s behalf) contains values only up to 1960 – exactly as in the figure produced in TAR. So once again, we have another egregiously false accusation from Steve McIntyre, one that has been echoed by McIntyre acolytes and CruTape Letters authors Steven Mosher and Thomas Fuller.
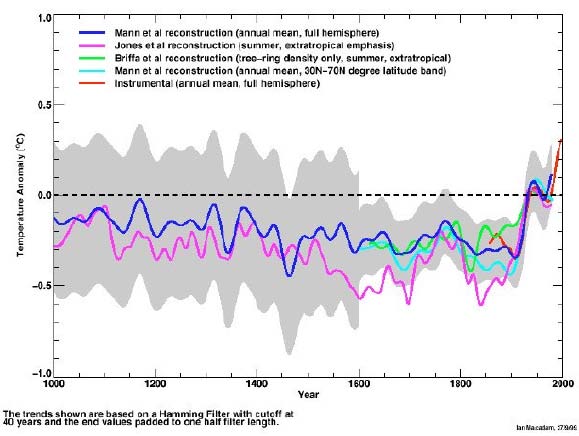
Regular Deep Climate readers will recognize immediately the chart at the centre of all the controversy, namely TAR Figure 2-21 showing various reconstructions of Northern Hemisphere tempearture. Most of the attention has been on a supposed “trick” to “hide the decline” after 1960 in the Briffa 2000 reconstruction, shown in green below. (Because of the oft-discussed “divergence” between temperature and tree-ring density, Briffa himself did not generally show the last 20 years of this reconstruction when using it to show comparative millenial temperature history; neither was post-1960 proxy data used to in the calibration of the reconstruction against the instrumental record.)
 Previously, I discussed McIntyre’s claims that the climategate emails of late 1999 demonstrated pressure on Keith Briffa to produce a reconstruction more in keeping with Mann’s “hockey stick” reconstruction, preferably omitting the post-1960 “decline”. An examination of email passages omitted in McIntyre’s account show that it was Briffa who wanted to rush inclusion of his latest “low frequency” reconstruction, but was advised by Mann that it would have to wait until the Second Order Draft in early 2000.
In recent weeks, McIntyre has adjusted his narrative to add new details to his allegations about TAR 2-21. One specific issue he has raised is that of “padding” and “smoothing”. Smoothing refers to various techniques to “smooth” out a data set to remove the “noise” of high-frequency fluctuations, such as interannual variations. These techniques usually require a transformation of each data point by incorporating neighbouring data, for example, in a low pass filter (usually implemented as a weighted centred moving average).
Such techniques often require “padding” of the data set with extra data points for use in smoothing as one approaches the end point. McIntyre has recently made a number of allegations about how such “padding” was performed in the handling of the Briffa data set.
As far as I know, the first time McIntyre raised this issue was at his Heartland conference presentation on May 16 [PDF]. There he stated:
However, Mann’s spaghetti graph in the First Reviewer Draft a few weeks later (see Figure 8) had no inconvenient 20th century decline. It used what Jones later called Mike’s trick. While climate scientists later described the trick as “sophisticated”, its main element was very coarse – adverse data after 1960 was simply deleted. A second element of the trick was a little more subtle. Any smoothed series requires forward values to calculate the smooth. It appears that Mann substituted instrumental data for actual data after 1960 to calculate the smooth before truncating the smooth in 1960. This pulled up the end values of the smoothed series, further disguising the decline. … [Emphasis added.]
More recently, McIntyre provided this summary:
… Mann replaced post-1960 values of the Briffa reconstruction with instrumental values, then did a smooth, then truncated the Briffa reconstruction back to 1960. Post-1960 instrumental values affected the smooth by the arithmetic of the smoothing filter.
Before diving into the detailed examination of McIntyre’s claims, I’ll briefly describe my emulation of three of the NH reconstructions in TAR 2-21. Here is TAR 2-21 from 1400-2000, showing three key reconstructions, namely Mann et al 1999 (black), Jones et al 1998 (magenta), and Briffa 2000 (green).

And here is my admittedly less sophisticated emulation (based on a high-order Butterworth low pass filter with a Hamming weight window):

Obviously the smoothing in the IPCC version is, well, smoother, especially from 1600 to 1700. So I certainly make no claim that this is an exact emulation. However, the emulation is close enough to evaluate any major differences between “padding” techniques.
One curious fact is that in order to reproduce the 1940 Briffa peak, the series must be realigned upward by about 0.06C or so. (Unravelling the reasons for this has been an interesting exercise in itself, but I’ll leave the explanation for part 2).
Alert readers will note that the MBH curve is labeled as having been padded with the instrumental mean beyond the end point for purposes of smoothing. This was acknowledged by Mann in a recent comment at RealClimate, where he also explained the rationale for the technique, but noted that he no longer uses the method. However, it is not certain that the padding of the other two data sets was done this way, as explained below.
It’s perhaps one thing to establish a smoothing boundary in one’s own data set by padding with an instrumental mean from a subsequent period to better estimate behaviour at the end point. But with regard to the Briffa data set, it is McIntyre’s contention that “it appears Mann substituted instrumental data for actual data after 1960”.
In answer to a post by physicist of Arthur Smith (who demolished similar claims by Steven Mosher and Thomas Fuller concerning the Briffa series in the AR4 “spaghetti graph”), McIntyre detailed various options studied by his team:
In TAR, the 1960 value of the smoothed Briffa reconstruction is about -0.03 deg C or so, as opposed to the -0.15 deg C in AR4. Mann used a different filter (40-year hamming rather than gaussian), but this, in itself, is not enough to account for the difference. TAR itself doesn’t even disclose the deletion of the data, so it is little help in reverse engineering what Mann actually did. A couple of different alternatives have been experimented with by Jean S, UC and myself, each of which involves padding 20 years of something else from 1960-1980 instead of actual data. Jean S and UC have got pretty good replications using variations of (a) actual instrumental data; (b) average instrumental data 1961-1990 (zero by definition of the reference period). After replacing/substituting actual Briffa data with something else, Mann then smoothed and truncated back to 1960.
Here McIntyre implies that all of the 0.12C difference between the end points of the Briffa series in AR4 and in TAR can only be accounted for by padding with instrumental values or the instrumental mean. This is false, as we’ll see below.
Curiously, McIntyre refers to the “40-year Hamming filter”, but neglects to mention that the padding technique was also specified in the same sentence of the original caption for TAR Figure 2-21, which refers to “boundary constraints imposed by padding the series with its mean values during the first and last 25 years.”
The average temperature anomaly of the Briffa data series from 1936-1960 (i.e. the last 25 years) is -0.07C, while the 20-year instrumental mean for NH in 1961-1980 was -0.064, a difference of only 0.006C. I’ve also looked at padding with the 25-year instrumental mean, the 30-year instrumental mean and actual instrumental values (in all cases the padded values are shifted upward by the same amount as the series itself). Here’s how the various padding options play out for end point smoothing in my emulation:

Left: Effect of padding on Briffa 2000 reconstruction. Right: Briffa TAR 2-21
It turns out the effect of the different padding values is not great, at least in my particular emulation. The actual shape of the last part of the curve is best reproduced by padding with the mean of the last 25 values (1936-1960); both have only a little bump up from a local minimum at 1958. The final 1960 value is at -0.04C, lower than the actual curve at -0.025C.
The two alternatives touted by McIntyre seem much less likely: the 30-year mean has a pronounced upward tick with an early trough at 1954, while padding with the instrumental mean results in a flattening but no upward tick at all. The 25-year instrumental mean (1961-1985) does come quite close however.
But in the end, none of this is particularly conclusive as such small differences in end points could move up or down depending on the exact smoothing used. For all this talk of “hiding the decline”, it turns out that padding with the 25-year instrumental mean rather than the final 25-year series mean only makes a difference of one-hundredth of a degree!
An examination of the Jones et al series sheds further doubt on McIntyre’s padding guesses. Here we look at both post-1980 and post-1991 padding (since the Jones series stops in 1991, but is shown up to 1980 in TAR 2-21).

Clearly, the use of instrumental values or mean is incompatible with the end of this series.
As a final indication of just how small a molehill McIntyre is attempting to build into a mountain, take another look at the full Briffa series in the chart I displayed above.
If you look carefully at the end of the green Briffa series in 1960, you might notice a small distortion. In fact, I’ve shown the series twice – with both the instrumental mean and series mean padding. It’s hard to see even when you know both are there; at normal viewing resolution the tiny difference from these two padding alternatives would be imperceptible.
Now let’s turn finally to the first part of McIntyre’s accusation: that Mann “deleted” actual values and “replaced” them.
McIntyre has noted that Tim Osborne sent Mann the so-called “climategate” Briffa data set on October 5, 1999. Indeed this particular data set did run up to 1994. However, McIntyre has conveniently omitted the fact that Osborn explicitly stated:
They go from 1402 to 1995, although we usually stop the series in 1960 because of the recent non-temperature signal that is superimposed on the tree-ring data that we use. [ PDF p. 15, 939154709.txt].
Even worse, the above claim that a truncated version of this data set was used in the First Draft of TAR is erroneous. That chart clearly used a previous “low frequency” reconstruction starting in 1600, not the “climategate” data set. And McIntyre knows this very well – because he displayed the chart in his Heartland presentation.
 In fact, as I showed recently, Mann informed Briffa and Osborn in his response on the same date that the new series was too late for the First Draft and would probably not be used.
During the early 2000 run up to the TAR Second Order Draft, Mann asked Briffa for the final published version of the reconstruction, along with the appropriate reference. Once again, Osborn replied on Briffa’s behalf.
No doubt it is this second email and data send to which McIntyre referred, when he claimed last November: “Interestingly, the values from 1402-1994 were sent from Tim Osborn to Michael Mann on a couple of occasions …”.
However, Osborn explicitly stated that he was only sending data up to 1960 “because of the problems with the recent period”. [ PDF p. 29, 951763817.txt]
Here is the end of the attachment (with contact information removed) from that email:
1955    -0.127

1956    -0.308

1957    -0.194

1958    -0.308

1959    -0.224

1960     0.076

Dr Timothy J Osborn                 | phone:

Senior Research Associate           | fax:

Climatic Research Unit              | e-mail:

School of Environmental Sciences    | web-site:

University of East Anglia __________|   http://www.cru.uea.ac.uk/~timo/
That’s right. Briffa’s data set only went up to 1960, so that’s exactly what Mann started with. No more, no less.
So, once again, the accusation that Mann “truncated” or “chopped off” the data set is proven to be utterly false.
The whole point of showing multiple reconstructions is to present researchers’ best estimates of past temperature. It was perfectly reasonable for Briffa to omit the recent portion of his paleoclimatic record known to be at odds with actual temperature, especially when that section was not even used for calibration.
Having said that, I do support calls for more detailed explanations, documentation and archiving of data sets used in IPCC reports and perhaps even drafts. AR4 was certainly a step forward in that respect, and no doubt that trend will continue in AR5.
In the end, one compelling reason to do this is to provide a preemptive defence against unwarranted criticism. One never knows when self-appointed climate science inquisitors will bend the truth in an attempt to portray legitimate scientific inquiry as something nefarious.

“neither was post-1960 data was not used “calibrate” the reconstruction.)”
Too many negatives.
[DC: Should be fixed now. Thanks! (Somehow the wrong uncorrected version got published – sigh). ]
Nicely done, DC – we need more of this. Almost anything can be framed as scientific fraud when there isn’t enough context, so posts like this are vital.
Cheers
Kate
http://climatesight.org
[DC: Thanks for stopping by and for the kind words. ]
Sorry for your first comment to be grammar policing. I’d feel no offense if you didn’t publish it.
Real thoughts: It is striking how utterly inconsequential this is. But I don’t understand how we got to this point.
If I follow correctly, the original Figure caption describes how the padding was done. You show that it is perfectly possible that they did exactly what they say they did.
ON the other hand, McIntyre is convinced they did something else. My question: why? To reach his conclusion, McIntyre must have done something akin to what you just did, and gotten a result that matched poorly with the published result. Are you aware of where he has shown this?
Maybe he was somehow able to get a better ’emulation’ than you did for your Figure 4 (consider numbering your figures), for one of the other options, but even if he did, the self-padded version couldn’t have been that far off either.
[DC: The only “padding” emulation I’ve seen at CA is from UC in this comment on the Arthur Smith post. He used “zero” padding, but I’m not sure if that is “boosted” to match the upward alignment of the Briffa series.
I’m not sure anyone at CA actually read the original figure caption that mentioned the padding with the “last 25” mean. On the other hand, it is true that MBH was padded with post-1980 instrumental mean. So it’s not entirely unreasonable to ask what was done in the other cases.]
DC, if you used series means for padding at both the start point and end point in your emulation, why does the start point of Briffa’s series appear to come down sharply from 0?
[DC: Ah, but I didn’t. I used zero padding at the start. I think there was a problem because the Briffa series started in 1402, but presumably start padding was not in the right place. The other reconstructions starting at 1000 (MBH and Jones et al) don’t have that problem. So this is clearly a mistake in the handling of Briffa in TAR 2-21. I was going to discuss this and other glitches in Part 2. ]
Which source are you using for Briffa’s graph?
[DC: The close up views of the end of the Briffa and Jones serie were produced by using the object tool in Acrobat to isolate the desired series and show it end next to the scale. ]
As you mentioned, MBH used different smoothing /padding methods then Briffa and Jones. This leaves Jones. I take it you are suggesting then that the glitch was in specifying the same code for startpoint padding for both Briffa and Jones. Yes?
[DC: In that comment, I was discussing the padding at the beginning of the series, a subject I didn’t discuss in the actual post (one thing at a time). As far as I can see the “start” padding for MBH and Jones (i.e. padded values up to year 1000) looks fine. It’s only in Briffa that there is the start glitch. This *may* have been an error in data preparation, for example, “padding” values placed in the wrong period, resulting in de facto zeros or blank values immediately before the series start in 1402. This would result in the deep descent from 1402 to 1450 when smoothed, as shown in the emulation. ]
Or it may be evidence of “0” padding at both ends of the series. I think I would have to see a working “case example” of your glitch with Mann’s matlab code. Given UC’s better fit to Briffa with 0 padding at the end it seems more plausible to me that both ends were simply padded with 0’s.
[DC: The problem is that “zero” padding at the modern post-1960 end is very close to some of the other padding alternatives. The “last 25” Briffa series mean (when boosted by the 0.062C offset I used) is -.008C. The 20-year instrumental mean is -0.002C and the 25-year instrumental mean is 0.019C.
Zero-padding would not work for emulating MBH of course. As for Jones et al, I padded with the mean of the last 25 series values, which was -0.32C. That’s already looking slightly high in my emulation, so zero-padding does not seem to work there either.
Also UC’s emulation seems to show the Briffa curve obscured at the end point by the other curves. I think he could get a more precise comparison by comparing to a high resolution, isolated version of the Briffa curve in TAR 2.21, as I have done.
Having said all that, a Matlab environment is most likely to be successfully emulate all the details. I’d be curious to see if UC has been able to emulate the smoothness of Briffa in 2-21 in the 1600-1700 period.]
UC has posted the full repliction 0f Briffa from TAR here: http://www.climateaudit.info/data/uc/TAR_pad0.png
From UC’s comments at CA he asks if this rules out a) Hamming weights being used in the smooth for Briffa; and b) series means being used as padding. Although for the latter he singles out the start of the series. I would suggest the excellent fit at the end might also rule out series means being used for padding the end of Briffa in TAR. I have asked UC to review this post and comment.
[DC: The emulation looks good. Probably using a builtin lowpass filter in Matlab gives a better result (the precise windowing weights are probably not crucial).
His question about series means was about padding at the start – that was clearly done with 0s (possibly boosted by the same +0.06C adjustment as the rest of the series), as mentioned above.
But it doesn’t appear that he has tested all the end-point padding options that I did. From the name of the file presumably he padded with 0s post 1960. Padding with the mean of the last 25 of the Briffa series (1936-60) or the next 25 of the instrumental period (1961-85) should give a very similar result, assuming that the padding value is boosted by the same amount as the rest of the series. For example, the “last 25” mean is about 0.07, but rises to almost zero if the emulation boosts the Briffa series by 0.645C (the value used by UC as I understand it).
UC’s update at CA Unthreaded starts here:
Also note that I did not find evidence of instrumental mean padding in Jones. I’m not sure if UC looked at that.
]
It is not just the padding that will influence the endpoint, it is the smoothing – as this will influence the slope of the series comming off the 1940 peak.
The endpoint values may well be close to TAR when padding with 25 year series means, but differences such those shown by you in your post are enough for exclusion when replicating.
A clear replication on Briffa (including the value of the endpoint) would allow for a check of the method on the Jones et al series as your “glitch” hypothesis implies that Jones and Briffa data are processed with the same method.
Actually, looking more closely at your graph of endpoint comparisons, I agree with you that 0 padding would likely be tough to distinguish from 25 year series means.
You say – “It was perfectly reasonable for Briffa to omit the recent portion of his paleoclimatic record known to be at odds with actual temperature, especially when that section was not even used for calibration.”
No..No… No…It is not “reasonable” to take a portion of a proxy – that’s cherry-picking – and that’s really the issue here. McIntyre is trying to piece together the puzzle of the fantastic rise in global temperatures presented by Mann’s graph (while temperatures were actually decling) – which McIntyre would not need to do if the “scientists” provided their methods for review – which they still have not done.
[DC: “Temperatures were actually declining”? Which period are you referring to here?
I’ve read the underlying Briffa papers. There is no question that the proxies were not tracking temperature well after the mid-twentieth century, at least in that particular MXD network, but had done so very well until then. ]
From UC’s comment: “Briffa +0.0645 zero-padding”. UC’s emulation (superimposed on Briffa) is a near perfect match except that the zero’s were started in 1957. There is no explanation given to justify the “0.0645” boost – just a necessary excersise to fit the replication to Briffa in TAR.
[DC: The question I have is whether the zero padding was also boosted by 0.0645C, or if the zero padding is in relation to the realigned series. In my various padding emulations the various means or instrumental values were also boosted to match the alignment of the series (I used 0.062C to get the match seen with TAR 2.21). ]
DC: If this is what McIntyre is hanging his hat on, there is surely a demonstration of such an emulation somewhere besides the comments section of somebody else’s blog. I mean, he has to show something, in order to make this claim, doesn’t he? Hopefully one of his readers can provide a link.
[DC: UC is one of McIntyre’s star supporters (along with Jean S and Roman M) . That was a ClimateAudit comment, and UC’s results are only available at ClimateAudit as far as I know. ]
RalphieGM: I think you’re a little confused. I don’t think anybody (except maybe you and other very confused people) thinks temperatures have actually been declining since 1960. I think the point McIntyre is trying to make is that since the tree rings are wrong after 1960, then maybe they are also wrong at other times, particularly before 1850 when we’ve got no direct measurements to check against. We’ve got plenty of thermometers and then satellites, as well as other indicators, for what has happened recently. The question here is what happened before 1850, before the era of widespread weather observations.
So you are saying that Briffa and Osborn provided a dataset with only values upto 1960, and Mann did not delete or truncate any values on his own, although he had another version of these from a previous email?
[DC: I’m not just “saying” it. It’s an incontrovertible fact that the data set provided on February 28, 2000, immediately following Mann’s request for the finalized data set, contained values only up to 1960.]
Osborn also tells Mann:
“This paper does not, however, give full details about how the reconstruction was obtained. The details are not yet published, but will soon be submitted:”
I cannot find these details on the Quaternary Science Reviews website.
[DC: The details were in the later Briffa et al 2001 JGR paper; this is the paper that was soon to be “submitted”. The QSR paper (“this paper”) was already published at the time that Osborn wrote that email. ]
I meant what source are you using for the annual data for Briffa’s graph?
[DC: Sorry for the misunderstanding. The Briffa data runs from 1402 to 1960, padded after that year in the various ways described. It initially came from the first data set sent by Osborn (the so-called “climategate” data set), which has the extended set up to 1994. As far as I know, the archived data set at NCDC and the final data set sent by Osborn are identical to that one, except that they both stop in 1960.
I will update the post with pointers to all the available data sources later today. ]
DC: Thanks.
What I am trying to get at is that, if anyone reads the emails directly, it is evident that Osborn did not provide data beyond 1960. He says so himself.
Quoting Osborn:
(I’ve already truncated the series at 1960 because of the problems with the recent period.)
[DC: I presume McIntyre read this email in November, because back then he referred to the fact that Osborn had sent the data twice. Yet, as fara s I know, he has never acknowledged that the data set only went up to 1960 in the second data set – quite the opposite. So perhaps not everyone has the clear understanding that you and I have. ]
So my question is: could you please point out which part exactly is new in your latest post, at least on this account? What are you trying to stress here? Because you do say:
“So, once again, the accusation that Mann “truncated” or “chopped off” the data set is proven to be utterly false.”
[DC: McIntyre made this accusation about the First Order Draft, which did not even use the QSR/”climategate” data set, *and* the final TAR version, which was based on the 1402-1960 data set sent in February 2000. “Once again” refers to the fact that the accusation is false for both the First Draft and “again” for the final TAR figure. ]
I am only asking because you have posted three times on this now, with slight variations, about the same thing. What is the overall message?
[DC: As far as I know, I first raised the fact that Mann was working from the 1402-1960 data set on May 13. I may have referred to it in passing since then. What’s new is that McIntyre has made fresh, more specific accusations since that time, which I have quoted in the post.
As well, I only recently had access to the data attachment from the second Osborn email. Yes, that corroboration should not have been necessary. But apparently it is, as McIntyre and his followers have yet to acknowledge these facts, as far as I know. ]
Secondly, you state above in your post:
“But with regard to the Briffa data set, it is McIntyre’s contention that “Mann substituted instrumental data for actual data after 1960″”
I cannot find McIntyre’s statement to this effect.
[DC: It’s in the Heartland presentation I quoted more fully a couple of paragraphs before. However, he did say “it appears Mann substituted instrumental data for actual data after 1960″, so I’ve added those two words. The contention is false, of course, as I’ve explained. ]
Let me clarify once more: I am asking you questions because when McIntyre responds (if he responds) I want to be in a position to understand what he says. You are trying to work things out (whether they be right or otherwise) instead of just slagging off as others do, and a certain amount of credit is due for that.
Osborn deleted the data himself, and that is a judgement call, not a matter of maths alone, and a separate thing from what you are trying to establish above. I would point out that I do not agree with that judgement but you may differ with me on that.
[DC: I just want to clarify one matter here. Osborn did not unilaterally “delete the data himself”. Briffa was the lead researcher and sole author of the QSR paper. So the presumption is surely that this was the version that Briffa wanted to send so there would be no mistake or misunderstanding. The original request was presumably sent by Mann to Briffa, since he was the IPCC contributing author, and Osborn was not. In other words, Osborn acted on Briffa’s behalf, as I have consistently noted. ]
Regards
DC, sorry if I missed this, I don’t see where you stated the filter width for your emulation. Did you use 40 year as in TAR?
[DC: Yes it’s a forty year filter. ]
So the latest salvage plan is to throw Briffa under the bus to save Mann. Interesting.
[DC: The point is that neither Mann nor Briffa did anything wrong. The only impropriety here is McIntyre’s refusal to withdraw his many false accusations. Why does he keep throwing himself under the bus? ]
DC, your inline comments do match with what I understood you were saying. So that is good. Thanks.
I would say McIntyre is just like you, only he has done this from a longer period of time and has other great admirable qualities, apart from analytical abilities. Your loaded vocabulary makes it difficult for you to see it, for others to see your abilities as well. Anyway this is IMO.
The way I see it, both you and McIntyre are hamstrung when trying to reconstruct what has been done to arrive at your results.
Of course, I was not trying to imply that Osborn deleted the data himself, although it is clear he ‘did’ it – he must have done it on behalf of Briffa.
Cheers
>>”The point is that neither Mann nor Briffa did anything wrong.”<<
LOLOLOLOLOLOLOLOL!!!
DC,
One can’t but feel that your claims to authority in these issues would be vastly improved if you blogged under your real name and included some biographical details so that people could guage your provenance.
In my book people who hide their true selves generally have other things to hide as well
I agree with Dave. How are we supposed to hack your email if we don’t know who you are?
What part of any analysis by Deep Climate depends on whom Deep Climate is outside of the internet?
That is patent nonsense. It could be Ronald MacDonald who produced the same analysis, and it wouldn’t matter. You’re essentially saying that truth depends on who said it. If that were true, an ad hominem wouldn’t be logically absurd.
Of course people have other things to ‘hide’ from others. There are some nefarious people out there…maybe DC doesn’t want family contacted by foaming at the mouth fanatics.
Dave Andrews,
Are you unable to judge an argument based on its merits? That’s a little disappointing.
Nothing that DC is doing requires a ton of technical expertise; just a lot of patience. You could repeat it at home, if you wanted.
In my book people who hide their true selves generally have other things to hide as well
Like Mark Twain? John Wayne? How about Publius?
Dave Andrews, how about Nigel Persaud, I mean Stephen McIntyre?
Yes, I imagine that McI does have things to hide…
Shub
‘Your loaded vocabulary makes it difficult for you to see it, for others to see your abilities as well. Anyway this is IMO.’
Oh the irony!
Just out of interest, are you comparing your output to the fig in the pdf, bt just matching them? You probably shouldn’t expect an exat match as PDFs don’t always maintain the same ratios in the x and y axis – there can be slight distortions etc. Would this explain UC requirement to have an arbitrary boost of 0.0645C?
Nathan:
Check out DeepClimate’s post. He is trying to replicate the Briffa reconsrtuction, he calls for open data access.
What do you think McIntyre does and calls for?
McIntyre and others call for open data access in the spirit of enquiry and audit before grand societal committements. DeepClimate calls for data access to preempt the moral high ground that would be lost without it.
Have fun.
[DC: That is, shall we say, an interesting interpretation of my views. ]
Yeah, and we can’t trust anonymous journal reviewers, either, because, well, they’re anonymous.
And Stephen Goddard …
I feel that two different languages are being spoken here. There’s the language of science which uses the methods of science, and there’s the language of anti-science.
The latter is easily recognisable because it starts from the premise that a scientist is guilty of a crime, and seeks to find precisely what crime it was (the only thing worth knowing, obviously).
In this case the fact that all the evidence refutes the premise is dismissed as a minor detail that can be remedied by continually switching the narrative in the hope of finding one that, with a bit of squinting and in a dim light, might conceivably be read as allowing that a crime *might* have been committed, thereby supposedly justifying the premise.
My friends, let us admit at least that the latter form of inquisition is simply dishonest. We can go back through the months and see how the liars have continually changed their narrative as each of their false claims has been exposed. They ought to be ashamed by now, but they know no shame.
[DC: As I ‘ve said before, it can be difficult to distinguish bias and incompetence from outright dishonesty. Be that as it may, there is no doubt that many falsehoods about climate science have been put forth, and few have been retracted. ]
Earlier, CarrotEater wrote:
“Real thoughts: It is striking how utterly inconsequential this is. But I don’t understand how we got to this point. ”
Which I second. DC – your analysis is obviously painstakingly attuned to detail, and I want to thank you for pointing out yet another McIntyre Mistake. I really wish that we didn’t have to drop to this level of discourse, and that the “bigger picture” was more important.
Our bed has been made, so to speak, and we have to lie in it. Meanwhile, we are forced to sit and debate thread counts and padding techniques, all of which have no bearing on the fact that the duvet is too damn hot.
On the contrary, in addition to patience it also requires the attention to detail and a special attitude I would call “lawyerly”. DC has this in droves (as have some of the folks on the other side), but scientists typically have not. I don’t, and I’m not even really interested in it. But I admire DC all the more for it.
Either which way, in no way is DC ever claiming any personal authority. He never says, “I am a xyz and from my work in xyz (which has nothing to do with climate), I am qualified to now tell you all about climate”.
Rather, DC rather simply tells you what he did, and how he did it.
So when Dave Andrews speaks of DC’s claims to authority, he’s already wrong.
That was the point I was trying to make.
Is it a terrible idea, when referencing McIntyre, to routinely use the modifier phrase “retired mining engineer Steve McIntyre?” I’m aware of the potential appeal to authority cross-currents and other possible unintended consequences, but I also weary of lay conflation of his expertise with that of serious scientists in the field. It’s hard for H. ordinalis to tell the players without a program. The idea and rationale aren’t so far fetched–consider if statements that Inhofe makes during hearings and interviews are attributed to “James Inhofe” rather than to “U.S. Senator James Inhofe.” The general public easily could begin to perceive Inhofe as a climate research expert, rather than a politician (deniosaurs routinely have complained of this with Gore, although few don’t know who/what he is/was). The same idea applies to Watts, and especially to Monckton.
Deep Climate, in response to your comment I would say that at the heart of this is their continual spinning of new scenarios and narratives to fit a preselected conclusion. That is dishonest, flies in the face of all the evidence and has nothing to do with “auditing” of a by now ancient and long superseded paper. And it has nothing to do with science. Let’s call it what it is: a vendetta against science.
[DC: I do agree that the contrarian attacks are unscientific and represent in fact attacks on science and scientists according to a preconceived agenda. I’m just not sure what degree of self-awareness should be ascribed in each case. ]
Dhogaza, Gavin’s Pussy, carrot eater,
My point is quite simply that you all appear to have something to hide about yourselves, just like DC.
Why should this be the case? Why are you reluctant (afraid?) to post under your real names. Surely if you believe you are right about this then you should be willing to put your real names to your posts?
The fact you do not suggests you all have something to hide.
Dave Andrews, all your years on the internet and you haven’t learned enough to type “dhogaza” in google?
Until the net started getting a bit crazy that cutting-edge technique would’ve even gotten you my phone number and home address.
Now you’ll have to first google my handle, and afterwards, my name.
I’m not “hiding” anything, I’ve been using this handle for over 15 years.
Not that your argument has any legitimacy to begin with.
BTW the fact that my real name is so easy to find has led to some attempts at intimidation, including someone listing the names of some of my clients on a thread at dotearth, which is very much out-of-bounds in my book.
So I can understand why some people use a handle that is not easily traced back to them.
Actually, the most recent idiocy had someone named “anon” put forth my real name here and at Keith Kloor’s blog, with some personal details.
That person posted under the untraceable handle “anon”. When questioned as to why he felt it was reasonably to “out” me while remaining untraceable himself …
Care to guess what he said?
Because I’m posting at work and it’s against the rules and if my real name is posted I might get fired.
Typical denialist hypocrisy, not respecting the privacy of others while hiding behind “anon” because he’s cheating his employer.
Maybe some people don’t want to be on lists which others wish to exploit. Maybe they don’t want their personal lives to be impacted by their work. Death threats, Breitbart offering money for Google group lists to find even a whiff of impropriety, more of the same a la Climategate.
You must be living under a rock if you can’t appreciate some peoples wishes to keep work, play and home life separate.
So my first reply went to the wrong place… Dave Andrews, earlier I did comment on Tamino’s, also answering to you sometimes, under my own name. What I have since understood is how careful you were in your formulations then, knowing that I was an active Earth scientist. Now you’re much more like your real self 😉
On the topic of McIntyre frivolity…Mann has been cleared of the final softer allegation against him:
Click to access Final_Investigation_Report.pdf
Interesting note from the report:
“The next question for Dr. Mann was posed as follows: “What is your reply to the email statements of Dr. McIntyre (a) that he had been referred to an incorrect version of your data at your FTP site (b) that this incorrect version was posted prior to his request and was not formulated expressly for him and (c) that to date, no source code or other evidence has been provided to fully demonstrate that the incorrect version, now deleted, did not infect some of Mann’s and Rutherford’s other work?” Dr. Mann responded by stating that neither he, nor many of his colleagues, put much reliability in the various
accusations that Dr. McIntyre has made, and that, moreover, there is “no merit whatsoever to Mr. McIntyre’s claims here.” Specifically, Dr. Mann repeated that all data, as well as the source codes requested by Dr. McIntyre, were in fact made available to him. All data were listed on Dr. Mann’s FTP site in 2000, and the source codes were
made available to Dr. McIntyre about a year after his request was made, in spite of the fact that the National Science Foundation had ruled that scientists were not required to do so. The issue of an “incorrect version” of the data came about because Dr. McIntyre had
requested the data (which were already available on the FTP site) in spreadsheet format, and Dr. Rutherford, early on, had unintentionally sent an incorrectly formatted spreadsheet.”
McIntyre is nothing more than a noise-maker. There’s unfortunately plenty of demand for his noise.
Speaking of vendettas against science Mann has been exonerated. All of Steve’s huffing and puffing amount to very, very little.
Saying “retired mining engineer Steve McIntyre” would be false. Saying “Lord Monkton” is false too, but fun. Saying Inhofe is enough.
Dave Andrews
So the absence of evidence means the absence of innocence? What a bizarre world you inhabit.
The question you should ask yourself is: “Is DC correct”.
If you’re asking other questions, questions that have no relevance to the topic, then you are not really interested in the science. Rather you’re engaging in a political debate.
Actually, not “here” but at “Open Mind”. “here” looks like “Open Mind” so I got confused 🙂
[DC: Well, yes – we do use the same WordPress theme. ]
Lord Monckton, or more formally Viscount Monckton of Brenchley is the correct address, because Christopher Monckton inherited the title from his father.
Monckton’s misrepresentation of his status is in his false statement that he is an “honorary” or “nonvoting” member of the UK’s upper legislative chamber, the House of Lords. The misrepresentation has been repeated, presumably through ignorance, in the United States Congress.
As a hereditary peer he is entitled to stand for election to the Lords, and he has done so, once, in a by-election following the death of a sitting member, in 2007. He was not elected and is not entitled to claim any association with the House of Lords.
Thank you for the precision of your correction, Tony Sideway. I should edit accordingly, with something like “Viscount Monckton of Brenchley is true, and fun to say”, although the feel to address to the Viscount is quite rare for me. And since we’re at it, we should note that addressing someone is not exactly the same as referring to someone.
Third Viscount. Not earned, just an accident of birth.
> I would say McIntyre is just like you,
Shub, yes and no. DC has internalized the sad lesson that McI and others have taught the world, that doubt and suspicion are much more saleable products than good science. And is giving the auditor a taste of his own medicine. But — evidence based.
“Lord Monckton, or more formally Viscount Monckton of Brenchley is the correct address,”
Hmph. For Independent-minded USians, we do not stand on such formality.
“Vicky” or “Chris” is therefore the correct address.
Pingback: Morano and Lindzen: Mann exoneration a “whitewash” « Deep Climate
PT: You must be living under a rock if you can’t appreciate some peoples wishes to keep work, play and home life separate.
So why are these same people who want to keep their work, play and home life separate trying to ruin those same desires for climate scientists, even to the extent of criminal theft of private emails?
THAT is the source of the hypocrisy.
[DC: I think you are having a violent agreement with PT. ]
Ah lack of prepositions are always a bugger, DC.
Pingback: Distinguishing deniers from skeptics | Klimapolis
Davey, my anonymity is a courtesy to folks like you, so you can switch the subject without much loss of face when you lose an argument.
So little gratitude…
[DC: GP’s response to Dave Andrews is continued here. ]
So is the TAR graph Briffa 2001 or Briffa 2000?
The e-mail from Osborn that you have above with .076 in 1960 is from Briffa 2001.
[DC: No. The email specifically references Briffa 2000. The same reconstruction was used in Briffa et al 2001, making the point somewhat moot, but the latter had not even been submitted at the time.
Here is the entire email (minus the quote from the previous Oct 1999 email):
See PDF, p. 29 (at the end).
]
I’m going off the e-mail you have above, with a .076 value for 1960. In the NCDC source, briffa2001jgr3.txt, this value is listed under Briffa 2001.
[DC: The same reconstruction was presented in both papers. ]
GP,
If people have threatened you I abhor that. My approach is to be my honest self, however, and I’ve never generally seen a need to hide my name. After all, contrary to what some have said above, how could I reasonably expect others to heed my words if I hide my identity?
No Dave, for clarity, I have never been threatened. (Keeping fingers crossed)
“how could I reasonably expect others to heed my words if I hide my identity?”
Because your arguments live or die on their logical strengths and weaknesses and not on your name? And so does everybody else’s? Online, we are *all* disputing arguments, *not* names. What the hell do I care what your name is? Are your arguments more logical when you write “Dave Andrews” next to them than if you write “Joe Blow”? Am I supposed to be impressed with “Dave Andrews”? Really, this is basic rhetoric. Get a grip, “Dave”, if that’s really your name anyway.
Dave Andrews
“My approach is to be my honest self, however, and I’ve never generally seen a need to hide my name. ”
Seriously, who cares?
“After all, contrary to what some have said above, how could I reasonably expect others to heed my words if I hide my identity?”
Your identity is hidden, as how do we know your real name is ‘Dave Andrews’, and how many ‘Dave Andrews’ are alive in the world? Or the US? Seriously this is just a dumb argument.
I entirely agree with Nathan,
There’s no need to use your full name
Yeah, right on Greg…
Totally agree.
See Dave Andrews… All these really truly indentified people agree…
😉
DC
I played a really good joke then… But it’s lost for all time 😦
I’m confused. The briffa2001jgr3.txt has a column heading labeled Briffa 2000, and one labeled Briffa 2001. The Briffa 2001 contains the value you used. What is the Briffa 2000 column?
[DC: I’ll have an answer tomorrow, if no one else does. In general, you have to look at the caption to get the correct refs. ]
The figure caption reads:
“three northern Eurasian tree ring width chronologies for 1000-1987 (green) from Briffa and Osborn (1999).”
So I would say the column heading in the data file is in error and that data set is actually as described in the caption (not Briffa QSR 2000).
Hi,
How is the “Instrumental data” padded & smoothed ? I think I can replicate all the other series quite correctly, but instrumental seems a bit problematic.
[DC:I haven’t looked at the instrumental series. But I’d be surprised if it were smoothed and padded the same way, given the length of the series.
What did you conclude about padding and smoothing in Jones et al? ]
Start of Jones series seems to be mean 25-year-mean-padded, but the smooth ends at 1980, difficult to say how the end is padded. Probably smoothed and then chopped.
Why instrumental should be padded differently?
[DC: On Jones, the point is that the series went to 1993. In my view, the evidence is conclusive that 1981-1993 values were *not* replaced with instrumental values or instrumental mean. Post-1993 padding is less obvious, but more consistent with padding series mean rather than instrumental values or mean.
In the case of Briffa, of course, the original series as sent by Osborn on Feb 5 2000 stopped in 1960. So we know that no existing post-1960 values were removed or replaced by Mann. In my emulation, paddings that give close end point emulation would include “0” padding (not shown), series 25-year mean, and instrumental 20-year mean and 25-year mean. However all these paddings are relatively close together, when one takes into account the boost to the Briffa series (i.e. all are within the range -0.01C to 0C). In my emulation, the two worst paddings for emulating the shape and end point were the two suggested by McIntyre (30-year instr mean or actual instr values). But even here, the difference in the final result is minimal and barely visible at normal viewing.
My thoughts on the instrumental record is simply that the length is short (~80 years), so a 40-year filter with 25-year mean padding might distort the end points unduly. I have not attempted to emulate this curve though.]
Maybe the instrumental series is “minimum roughness”-padded, to boost it above the reconstruction error limits ?
[DC: I’m not sure that method existed at the time. ]
re [DC: I’m not sure that method existed at the time. ]
I think it was embedded in Matlab filtfilt.m at the time this figure was published.
I guess I’m just not satisfied with your emulation and am wondering if you are using the right source.
UC, are you using the same source?