
 2018 was the fourth warmest year in the global surface temperature record, according to year end updates from NASA, NOAA and the UK MetOffice, albeit somewhat cooler than the 2016 peak. This continues a string of record or near-record annual temperatures, with the top four occurring in the past four years.
As in my previous updates (see here and here), I’ll provide some additional context, highlighting the issue of coverage bias and ongoing Arctic warming. Series that use statistical methods to account for areas with few or no observations, especially in the Arctic, continue to diverge markedly from those with little or no interpolation. Recent observations also show the emergence of a seasonal pattern in Arctic warming, an important aspect of coverage bias that has been less explored thus far. In addition, the last decade or so has seen the emergence of ship-buoy SST bias, first identified in a key 2015 paper from NOAA and confirmed in our 2016 paper.

 Over the past few weeks, there has been much discussion of global surface temperatures, as 2016 broke the previous 2015 record in all surface temperature series. Here I will place 2016 in context, highlighting the role of rapid Arctic warming in recent surface temperature evolution as seen in a comparison of four operational data sets. The 2016 increase over 2015 was much larger in the analyses that account for missing areas, especially the Arctic, providing additional impetus to address coverage bias among research groups that still have not done so. I’ll also take a quick look at the growing effect of residual biases from ship-buoy measurement adjustments in sea surface temperature (SST) analyses in recent years, which has led to some additional divergence between the two major operational SST series underlying these four global series.
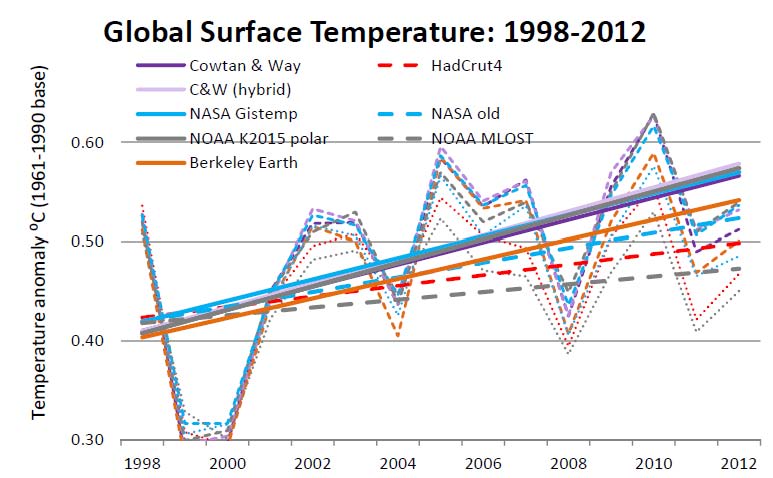


